
The Western Development Commission (WDC) has compiled a set of timely economic indicators for the Western Region (WR) and Atlantic Economic Corridor (AEC).
The third report in the series has been published today.
Join our Insights Mailing List
In this Insights blog post, I provide a commentary on the report.
Labour Market
The labour market dynamics within the WR & AEC are largely determined by pre-existing structures of employment and economic activity. Distinct features include an enterprise structure more heavily reliant on micro-enterprises and a historical pattern of concentrated employment within the tourism sector (WDC, 2020).
Joint research by the Central Bank of Ireland and the WDC showed that the initial COVID-19 shock to the labour market hit the WR & AEC comparatively hard, likely as a result of these pre-existing structures (Lydon & McGrath, 2020) . A convergence across the WR & AEC back to the national average occurred through the re-opening phases but as the public health restrictions were enhanced that regional variation has re-emerged.
The share of the labour force in receipt of the Pandemic Unemployment Payment (PUP) was back at June levels during January. Kerry (26%) had the highest share nationally, during the week ending the 26th of January. Donegal (23%) was 3rd and Mayo (22%) was 6th. Lydon & McGrath (2020) show how the within region variation is likely explained by sectoral exposure to the COVID-19 shock. For example, Donegal, Kerry & Mayo have particularly large shares of employment within the accommodation and food sector.
The current levels of “non-employment” gives us an indication of future “unemployment”. If the current regional variation in non-employment levels translate into unemployment in the medium term, then it seems reasonable to anticipate similar regional variation in unemployment rates. The Winter ESRI quarterly economic report examines various scenarios for the economy and the consequent impact on the labour market. The ESRI projects a national average unemployment rate of between 14.5-15% for 2021. Medium term unemployment at both the national & regional levels will be largely determined by sectoral exposure to the COVID-19 crisis and related public health developments/containment measures as well as potential Brexit related impacts.
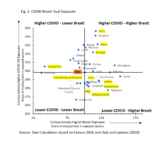
Daly & Lawless (2020) show that no individual sector faces severe dual exposure to both Brexit and COVID-19 but as Lydon and McGrath (2020) argue this may not be true at the county level. I have tried to gain some insight into this dual-exposure risk at the county level by combing Census 2016 employment data, by sector, with the sectors identified by Daly and Lawless (2020) to be “severely affected ” by COVID-19 and those sectors deemed to be “severely affected ” by Brexit. Figure 1 displays the results as a quadrant of relative dual exposure compared to the state average. Kerry, Donegal, and Mayo are all in the upper right quadrant of the graph indicating a comparatively high level of exposure to both COVID-19 and Brexit.
In the longer term, the extent of the economic recovery from the crisis will ultimately depend on the ability to enhance productive capacity and grow employment from the trough. The WDC argue that Infrastructure, the ‘3Es’ (Enterprise, Employment and Education) and Innovation are the key levers for effective regional development as detailed in WDC (2010) and WDC (2011). When these three areas complement and support each other, they drive regional growth.
Detailed information on the new wage subsidy scheme (EWSS) is not available but we can gain insight by looking at the trends in the old scheme (TWSS) where a strong regional impact was observed. There had been an increase in the share of TWSS supports across the WR & AEC from May to the end of June compared to a decline nationally.
The rise had been driven by females and to a lesser extent younger males and may reflect the fact that the employment share in the heavily COVID-19 exposed “accommodation and food services” sector with that sector availing of more TWSS support. Within that sector the WR & AEC hold a comparatively larger share of female employment (WDC, 2019). Jobs within the accommodation and food sector supported by the wage subsidy scheme may be more vulnerable as noted in my previous blog.
As the EWSS replaced TWSS at the end of August many counties were at or above the national average, in terms of labour force share. Based on data from Revenue, the WR & AEC average was 15% of the labour force in recipet of EWSS in September with a large range from 9% in Roscommon to 19% in Kerry. EWSS supports then fell to 13% of the labour force during December, ranging from 8% in Roscommon to 15% in Kerry. December EWSS data shows most WR & AEC counties below the national average.
The within region variation is again related to the structures of employment and economic activity. The decline in EWSS supports reflect a flow onto the PUP and the live register.
Consumption
There was a recovery in new car licences during Q3 following the Q2 collapse. New private car licences rose 48% (58%), year-on-year, in WR (AEC) during Q3, compared with a 30% increase nationally. There was a signal of a slowdown during November as licences fell 4% (10%) in WR (AEC), year-on-year, compared with a 12% decline nationally.
Year to date, all WR & AEC counties except Roscommon had a lower total decline in new car licences than the State average (from January to November). Roscommon, is distorted due to the activity of a national car hire company see here and here.
Housing
The initial supply side reaction in the housing market was a reluctance to reduce prices and instead to withdraw housing from the market (Lyons, 2020). On the demand side, we would expect individuals to put off long-term decisions like buying a house with such a high degree of uncertainty present. Both factors resulted in a sharp decline in year on year sales volumes particularly during Q2 and this has continued through Q3 and beyond.
It will be important to monitor the changes in sales volumes going forward as this will provide an indicator of consumer confidence and some insight into the extent of uncertainty people are experiencing.
On the supply side of the market, there was a collapse in dwelling completions during Q2. During Q3 there was a recovery in the WR (AEC) with year-on-year growth of 5% (12%) compared to a 9% decline nationally.
Commencement notices provide an indication of future supply and also collapsed during Q2. During Q3 there was a moderation in declines both nationally and in the WR & AEC.
The Q3 Residential Tenancies Board/ESRI report shows the impact of the pandemic on rents. Typically, Q3 is characterised by a rise in the number of tenancy registrations associated with the educational cycle. Consequently, the report notes that “year-on-year changes always provide a better insight into the trend”.
The pandemic has coincided with a moderation in annualised rental growth nationally but this is largely driven by the Dublin trend. The national year-on-year growth rate has remained below 2 per cent for two consecutive quarters for the first time since late 2012.As of Q3 2020, rents in Dublin are nearly twice the level outside Dublin.
During Q3 there was a year-on-year fall in rents in both Clare (-2.2%) and Sligo (-6.5%). However, the 2nd and 3rd highest year-on-year growth rates nationally were in Roscommon (7.1%) and Limerick (6.6%).
The report notes that it is difficult to link rental trends to broader economic activity given the “emergency and other legislation limiting price growth is likely altering the usual relationships between economic factors and rental inflation.”
The views expressed here are those of the author and do not necessarily represent or reflect the views of the WDC
Luke McGrath
Economist
Policy Analysis Team