
The Western Development Commission (WDC) has compiled a set of timely economic indicators for the Western Region (WR) and Atlantic Economic Corridor (AEC).
The second report has been published today.
In this Insights blog post, I examine some of the economics of the COVID-19 shock and provide a commentary on the report.
A very different type of recession
Before going into the statistics contained in the report it is useful to discuss some of the economics of COVID-19.
The standard Keynesian business cycle model posits that recessions are caused by a deficiency in aggregate demand (the total demand for goods and services in the economy). In the model, consumption, a key component of aggregate demand, is driven by changes in disposable income. When incomes fall (rise) consumption falls (rises). This positive correlation underlies the famous and oft-debated “multiplier” concept.
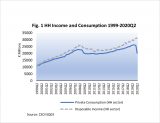
Using CSO data on Irish household disposable income and consumption spending from Q1 1999 to Q1 2020 we find an incredibly strong positive relationship as indicated by a Pearson correlation coefficient of 98.9. However, Fig.1 shows that this relationship broke down during Q2 2020. Household incomes rose but consumption fell dramatically and this has resulted in the noted surge in household savings.
Seamus Coffey (UCC & Chair of the Fiscal Advisory Council 2016-20) goes into this in great detail over at his excellent blog by detailing the flows of household income. Transfers from the government, i.e. the fiscal response to the pandemic, combined with lower taxes and social contributions paid has more than offset lower earnings. In a typical recession, this level of income support would normally filter through into consumption spending but this is not a typical recession.
An alternative model is the supply side focused Real Business Cycle theory where shocks to aggregate supply (the total supply of goods and services produced within an economy) are viewed as the driver of business cycles. The COVID-19 recession has elements of large demand and large supply shocks which make it a very different type of recession.
...fiscal policy can help support incomes and the healthcare system and in this sense might be thought of as disaster relief rather than traditional stimulus.... The WR and AEC in particular require this relief given the sectoral employment in the region has contributed to a large COVID-19 related shock.
The initial economic impact of COVID-19 may be viewed as a large negative supply shock that was then followed by a subsequent demand shock due to job losses etc. The fiscal response in Ireland appears to have mitigated the initial aggregate demand shock but people are uncertain about the future and so are putting off making large investments such as housing (see below on housing sales volumes). People are also less inclined and/or are restricted from spending in some retail sectors but are heavily spending in others such as “hardware, paints and glass” (see previous commentary – “Consumption”).
Going forward, demand and supply shocks will affect sectors differently. A recent study by del Rio-Chanona et al., (2020) using US data, show that sectors like transport will be constrained by demand shocks, while sectors such as manufacturing and services will be constrained by supply shocks. Tourism, a key sector for the WR and AEC faces large supply and demand shocks and that is before contemplating any Brexit impact.
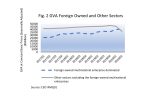
The differing impacts on different sectors is contributing to what Gerard Brady (IBEC) has been referring to as a K shaped recession/recovery. I touched on this within the commentary on our first report. Certain sectors are booming while other sectors have collapsed. The CSO has recently released new data that illustrates this very clearly (Fig.2). Gross Value Added (GVA), conceptually the same as Gross Domestic Product (GDP) i.e the value generated in an economy by the production of goods and services, in the multinational sector (dominated by pharma, medtech, IT and financial services), where the WR and AEC have a relatively lower share, was relatively flat year on year during Q2. In contrast, in the other sectors there was a stark decline.
The major takeaway is that fiscal policy can help support incomes and the healthcare system and in this sense might be thought of as disaster relief rather than traditional fiscal stimulus aimed at “jump starting” the economy. The WR and AEC in particular require this relief given the sectoral employment in the region has contributed to a large COVID-19 related shock.
Fiscal stimulus may also be appropriate for capital investment in long term projects such as energy, climate action and infrastructure again there are important regional factors that should be considered here as detailed by my colleague Dr. Helen McHenry in the recently published Making the Transition to a Low Carbon Society in the Western Region.
However we cannot forget the supply side constraints, fiscal stimulus cannot directly fix the uncertainty caused by the virus thus a healthy economy will likely only return when the virus is under control. This of course highlights the fact that the health of the economy and public health are interrelated.
Now, on to the latest economic data for the WR and AEC.
During May, the % of the labour force in receipt of state income supports reached close to 50% in the WR & AEC. This fell to 32% by 30th August.
Labour Market
During May, the % of the labour force in receipt of state income supports (live register + Pandemic Unemployment Payment (PUP) + Temporary Wage Subsisdy Scheme (TWSS)) reached close to 50% in the WR & AEC and ranged from 43% in Roscommon to 54% in Kerry.
This fell to 32% by 30th August, a range of 26% in Roscommon and 37% in Donegal. Kerry recorded the largest decline, 19 percentage points from May to the end of August.
PUP recipients fell from 105,542 (150,304) on 3rd May in the WR (AEC) to 30,924 (44,981) as of 27th September. However, there was a weekly increase in PUP recipients in WR (+170) and AEC (+183) during the week ending 27th September. It should be noted that Donegal moved to Level 3 restrictions on the 26th of September and the rest of the country on the 6th of October thus this impact will not be reflected in the data.
There was also a rise in PUP recipients nationally (+10,801) concentrated in Dublin (+10,035). Dublin moved to Level 3 on 18th September thus the initial impact of Level 3 restrictions are captured.
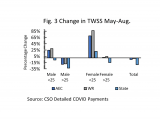
In relation TWSS supports we can see a strong regional impact that is not observed within PUP. There had been an increase in the share of TWSS supports across the WR and AEC from the May peak to the end of June compared to a decline nationally. As illustrated in Fig. 3 the rise had been driven by females and to a lesser extent younger males.
The TWSS trend may reflect the fact that the WR and AEC have a larger employment share in the heavily COVID-19 exposed “accommodation and food services” sector with that sector availing of more TWSS support. Within that sector the WR and AEC hold a comparatively larger share of female employment (WDC, 2019). Jobs within the accommodation and food sector supported by TWSS may be more vulnerable given the large demand and supply shocks to be faced, as noted above.
Consumption
We observed some signs of recovery in the car industry during Q3. July is a key month given the dual car registration system. Excluding Roscommon, due to the distortionary impacts of hire cars, WR (AEC) new car registrations rose 13-19%, year on year, during July. This is compared to a 16% national decline.
We must be careful here in our interpretation and note the perils of percentage change given the smaller numbers of registrations in the WR and AEC. Even with a national decline of 16% over 15,000 new cars were registered in July. In WR (excluding Roscommon) there was a total of 1,900 new car registrations.
Year to date, the percentage decline in new car registrations was lower in all WR and AEC counties except Roscommon when compared to the national average.
In July, there was also a year on year increase in new goods vehicles being registered in the WR (AEC) of 29% (26%) compared with a national decline of 16%.
Housing
The initial supply side reaction in the housing market was a reluctance to reduce prices and instead to withdraw housing from the market (Lyons, 2020). On the demand side, we would expect individuals to put off long-term decisions like buying a house with such a high degree of uncertainty present.
Both factors resulted in a sharp decline in year on year sales volumes particularly during Q2 and this has continued into July. Nationally, the collapse in sales volumes has been larger, in percentage terms, than in WR and AEC. It will be important to monitor the changes in sales volumes going forward as this will provide an indicator of consumer confidence and some insight into the extent of uncertainty people are experiencing.
The Q2 Residential Tenancies Board/ESRI report shows the impact of the pandemic on rents. The pandemic has coincided with a moderation in annualised rental growth. Q2 2020 was the first quarter since 2014 that annualised rental growth was below 10% in all 26 counties. However, the largest annualised increases in standardised rents were within the WR (Mayo 8.5% and Leitrim 7.9%). Standardised rents fell on a quarterly basis in Clare (-1.6%) and Sligo (-1.9%) and on an annualised basis in Clare (-0.5%).
Commenting on the report Conor O’Toole (ESRI) noted “The drop in inflationary pressures has been strongest in the Dublin area which is the country’s largest rental market. It is likely that continued downward pressure will be exerted on rents in the short term as the economy continues to struggle under COVID-19 conditions.” The Dublin trend and knock on impacts may reflect the large increase in remote working outside of the more densely populated areas.
On the supply side of the market there was a collapse in dwelling completions during Q2 year by 30% (34%) in WR (AEC) compared to a national decline of 32%. Commencement notices provide an indication of future supply and also collapsed during Q2 by 35% nationally and 29% (28%) in WR and AEC (-28%).
The views expressed here are those of the author and do not necessarily represent or reflect the views of the WDC
Luke McGrath
Economist
Policy Analysis Team