

Introduction
The CSO has recently published data on Household Disposable Incomes at county level as part of the ‘County Incomes and Regional GDP 2021’ release. This release contains useful trend data on incomes for counties as well as information about the levels of different household income components for each county. Data on regional GDP, which is also part of this release, will be considered in a future post.
Here I give an overview of the 2021 Disposable Income data (and the estimates for 2022) before considering some of the changes over time. The data for 2021 can be regarded as more robust than the 2022 estimates and so it is used for most of the comparisons here.
It should be remembered that the ‘Disposable Incomes’ as discussed in this post are calculated at a macro level and the county data is most useful for comparison among counties and over time. Indeed the CSO notes that “county calculations for disposable income are estimates and involve a certain degree of uncertainty, however, despite the uncertainty disposable income per capita allow us to visualise discrepancies in income between regions and counties.”
The focus of this post is on Disposable Income (see footnote [1] below for overview of how this is calculated or the ‘County Incomes and Regional GDP 2021’ release for more detail), and most of the discussion is on relative changes, among Western Region counties and over time rather than on the estimated income level which, given the methods used to derive it, is uncertain.
Per Capita Household Disposable Income in all Counties
The chart below (Figure 1) gives an overview of Household Disposable Income per person increased in all counties in 2021. It shows, unsurprisingly, that the highest disposable incomes are in counties in the east and south, while counties in the midlands, west and north have the lowest disposable incomes. The highest disposable income per person is in Dublin (€27,958) which, along with, Limerick, Wicklow, Carlow and Cork, had per capita disposable income greater than the state average (€24,376) in 2021, while Kildare, Louth, and Westmeath were just below.
Disposable income per person in Donegal lowest in the country (€19,253) with Roscommon (€20,477) the 4th lowest nationally. In contrast, Galway (€23,495) had the ninth highest disposable income per person, the next placed Western Region county was Mayo (€21,848) in 16th place. Only Galway in the Western Region had a disposable income of more than more €22,000 per annum, but all Western Region counties had per capita disposable incomes less than the state average Disposable income per person in the Western Region (seven counties) was €21,682 in 2021 (I have calculated this using inferred population estimates from the county data).
Figure 1: Disposable Income per Person for all counties, Western Region and State
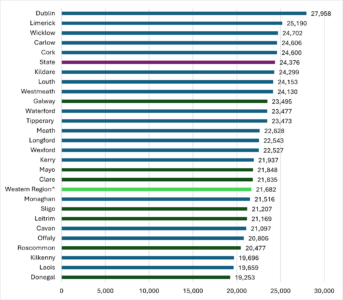
Source: CSO, 2024, County Incomes and Regional GDP 2021 Table 5.1 ^Western Region derived own calculations
Disposable Incomes in the Western Region
A summary of key data for Western Region counties is provided in Table 1 below showing short term changes (2021-2022), longer term changes (2012-2021) and the performance of Western Region counties relative to the state average.
Table 1: Disposable income data for Western Region counties
| County | Disposable Income per person 2021 (€) | Disposable Income per person 2022* (€) | Percentage change 2021-2022 (%) | Percentage change 2012-2021 (%) | Percentage of State Average 2021 |
| Donegal | 19,253 | 21,553 | 11.9% | 30.2% | 79.0% |
| Leitrim | 21,169 | 23,011 | 8.7% | 28.6% | 86.8% |
| Sligo | 21,207 | 23,557 | 11.1% | 28.5% | 87.0% |
| Galway | 23,495 | 25,400 | 8.1% | 36.1% | 96.4% |
| Mayo | 21,848 | 23,953 | 9.6% | 29.4% | 89.6% |
| Roscommon | 20,477 | 21,864 | 6.8% | 30.9% | 84.0% |
| Clare | 21,835 | 22,870 | 4.7% | 25.9% | 89.6% |
| Western Region^ | 21,682 | 23,564 | 8.7% | not available | 88.9% |
| State | 24,376 | 25,607 | 5.1% | 34.7% |
*CSO Preliminary Estimate for 2022. ^Own calculations for Western Region
Source: CSO, 2024, County Incomes and Regional GDP 2021 Tables 5.1, 5.1a, 5.3
Disposable income per person in Donegal has been consistently the lowest in the region (and nationally) but estimates for 2022 show the largest annual increase in the Western Region in Donegal (11.9%). The smallest increase in among Western Region counties was in Clare (4,7%) with Roscommon incomes only growing by 6.8% between the two years. Interestingly, between 2021 and 2022 Dublin only showed an increase in disposable income of 3.1% while three counties of the mid East (Kildare, Meath and Wicklow) all had disposable income growth of less than 2%. Nationally between 2021 and 2022 disposable incomes are estimates to have grown by 5.1%, while in the Western Region they have grown by 8.7%. (I estimated the Western Region average in 2022 to have increased to €23,564). As noted previously, the 2022 data is estimated by the CSO. More robust 2022 data will be published next year and it will then be clearer if this pattern of lower growth in more well off counties is confirmed Disposable Incomes in Donegal in 2021 were only 79% of the state average (though this is an improvement on 76% in 2017) and in Roscommon they were only 84% of the state average (no change from 2017). Only one Western Region county, Galway, had a disposable income of more than 90% of the state average (96.4%, an increase from 92% in 2017)), but Mayo (89.6%) and Clare (89.6%) were all close to that. The Western Region is estimated to have had a disposable income per person of 88.9% of the state average in 2021.
Changes in Disposable Incomes in Western Region counties since 2012
Looking back over a decade (2012-2021), there have been significant increases in income in all counties, the lowest in Clare was 25.9% and the highest in Galway (36.1%) which was the only Western Region county to have an increase larger than the state (34.7%). It is also interesting to look at changes in disposable incomes over time. This consistent growth is a welcome recovery from the financial crisis of 2008 onwards, the impact of which was discussed in more detail in this post from 2019. Figure 2 below shows trends in disposable incomes in the Western Region between 2012 and 2022. All of the counties show growth since 2012 although rates of recovery (since the financial crash) were not consistent until 2015. Galway has had the highest income in the region since 2015. In contrast, Clare, which had higher disposable incomes than Galway (and the highest Western Region) between 2012 and 2014, has declined relatively and now only has the 5th highest disposable income in the Western Region (2022).
Figure 2: Disposable Income per Person for Western Region Counties 2012-2022
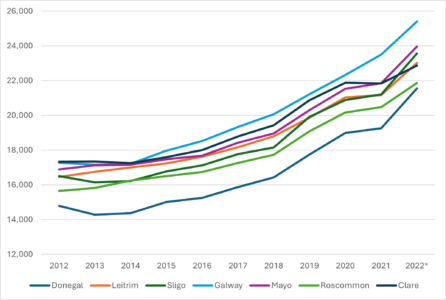
*CSO Preliminary Estimate for 2022. Source: CSO, 2024, County Incomes and Regional GDP 2021 Tables 5.1, 5.1a
Despite improvements most Western Region counties disposable incomes only recovered to 2008 levels by 2019, though Mayo did so in 2017, while Galway and Leitrim took until 2020 until incomes were above 2008 levels. It should be noted, however, that income figures continue to be revised over a long period so it is not possible to be definitive (see previous discussion in this post ). A flattening of the income growth trend appeared for all counties except Galway for 2020 to 2021. This may be associated with the Covid pandemic and will be explored further in a future post.
Disposable Incomes in the Western Region compared to the State
When considering how counties are doing it is interesting to compare Western Region counties to the state average. While Figure 2 shows the Disposable Incomes per person, when considering the trends among counties it is helpful to use indices, so that county figures can be examined relative to the state (State=100). Figure 3 provides insight on the more positive trends indicated above in Figure 2 with growth in disposable incomes in Western Region counties.
Figure 3: Index of Disposable Income per Person in Western Region counties 2012-2021, State =100
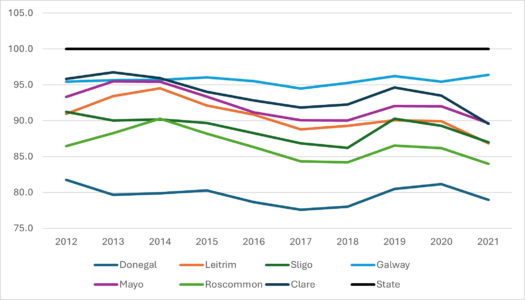
Source: CSO, 2024, County Incomes and Regional GDP 2021 Table 5.4
Relative to the state, however, growth rates in disposable incomes in the Western Region have recently been inconsistent, showing improvements in most counties in 2019, and declines in 2021. Indications from 2022 would suggest improvements relative to the state are likely for 2022 but that data may be revised.Nonetheless it is clear that since 2012 Disposable Income in all Western Region counties except Galway has declined relative to the state. The biggest relative decline is in Clare, followed by Sligo and Leitrim. Donegal and Roscommon, which were the only counties with Disposable incomes of less than 90% of the State average in 2012, showed less relative decline, though they remain weakest relative to the state with Donegal 79% and Roscommon 84% of the state in 2021. All Western Region counties except Galway had incomes lower than 90% of the state average in 2021.
Ranking of counties
While actual income levels are of course important, in considering regional trends it is useful to consider relative change among the 26 counties. Another way to look at how the Western Region counties are doing is to compare them to other counties and rank relative positions. In Figure 4, the rank of the Western Region counties is shown for five different years with different economic growth patterns. Starting with 2000 the early stage of the Celtic Tiger growth, then 2006 was almost the peak of the boom while 2012 was at the very beginning of the recovery, or at least in this data indicated the end of income decline. More recently 2018 was a period of continued recovery and growth, with 2021 in the mid Covid era.Disposable incomes in Galway showed an improvement from position 11 in 2000 to 9th in 2021, while Leitrim had a small improvement from 21st highest to 20th. The most significant changes were in Roscommon and Clare. Disposable Incomes in Roscommon were 14th nationally in 2000 and are now 23rd, while in Clare they were 8th highest nationally in 2000 and are now 17th highest.
Figure 4: Rank of disposable Income per person in Western Region among all counties
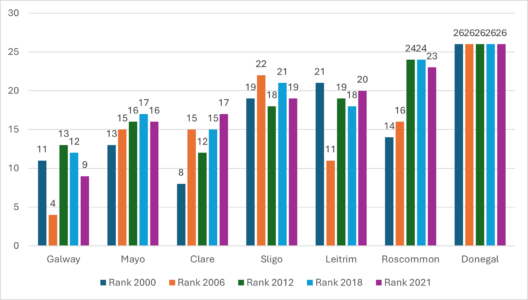
Source: CSO 2024 County Incomes and Regional GDP 2021 Table 5.3 and CSO 2020 Table CIA02
Donegal has had the lowest disposable income of all counties for the whole period. The chart indicates that disposable incomes in Roscommon in particular has suffered a significant relative decline, compared to other Western Region counties, since the crash.
Conclusion
Trends in county Incomes are inconsistent in the last two years, but all Western Region counties, with the exception of Galway continue to show per capita disposable income significantly lower than the state average. The data discussed here for 2021 and 2022 covers key parts of the Covid years, but implications of Covid for incomes in the longer term are hard to discern at the Total Income level. In a future post I will examine changes in components of income and discuss how Covid affected them in Western Region counties.Likewise, data from Earnings Analysis Using Administrative Data Sources (EAADS) provides other statistics on earnings at county level (older findings for the Western Region are discussed here). These will be examined in a future blog, to provide further insight into the factors behind changing household disposable income. Using different data sources on earnings along with other data on elements that make up household income, will give us an opportunity to gain a better understanding of patterns in earnings and some of the factors contributing to income differences in the Western Region.This post has provided a brief overview of the key County Income figures for the Western Region based on the recent CSO release. The growth and change in the regional economies as shown by the Regional GVA data will be examined in the next post.
Helen McHenry
[1] Disposable household income per county is a total of the compensation of income for employees, income from self-employment, and imputed rent of dwelling and net interest and dividends. Combined these give Primary Income and the addition of Social Transfers gives Total Household Income, the subtraction of Taxes from Total Household income gives Disposable Household income. This is divided by the county population to give Disposable Income per person.