

Understanding the reasons rural dwellers travel is essential to ensuring we can take focused, effective, and fair climate action and aid a transition to low carbon rural regions. In this the second blog post examining data on travel and journeys in Western Region counties and rural areas, the need to travel to services, the distance many rural dwellers live from everyday services, and the reasons why some journeys are not made are all considered. This post forms part of a series examining data and issues on rural travel and journeys as part of WDC work (some of which falls under Action 160[1] in the Climate Action Plan) on how we transform the Western Region to a low carbon region. A post on the rural emissions is available here and the first in this series covering issues of rurality and transport and the reasons for travel is here.
Distance to services
In the previous post on transport, the importance of travel for work and education were outlined along with the other reasons we make journeys. Travelling for work and business are clearly important, but most journeys are made to reach services of varying kinds. People living in rural areas tend to be at a greater distance from services than their urban counterparts and so the journeys made tend to be longer and more car based (both of which will be discussed in future blogs). Greater distance to services tends to reduce options for travel and in particular, given the lack of public transport and the distance to public transport services, increases reliance on car travel in rural areas.
This is highlighted in Figure 1 below, which compares the proportion living within 15 minutes’ walk of key services in rural areas compared with the national picture. Indeed the National Household Travel Survey also found that 40% of all rural respondents did not live within 15 minutes of any of these services.
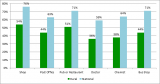
Figure 1: Percentage living within 15 minute walk of services, National Household Travel Survey, 2017
Source: National Household Travel Survey 2017
This can be seen more specifically at a county level (Figure 2) which shows the average distance (km) of residential dwellings to everyday services. This higher average distance to services for rural people means that rural dwellers are travelling further and for longer periods (discussed more in a future post) are more likely to need a car, which is the only way to access most of these services.

Figure 2: Average km distance to key everyday services for Western Region counties
Source: CSO, 2019 https://www.cso.ie/en/releasesandpublications/ep/p-mdsi/measuringdistancetoeverydayservicesinireland/ Statbank Table MDS02
The services shown in Figure 2 above are ones that may need every day access, other services such as banking, libraries and leisure services like swimming pools may be sued less often but have much higher average distances, again increasing the need for motorised transport (most likely a car). These are shown in Figure 3. The distance to hospital is greatest, and while some outreach services are provided, many people will need to attend appointments and on going treatment services in these hospitals. Some transport services are available but many will, where possible or necessary, use private transport of their own or with a friend, relative or volunteer.

Figure 3: Average distance (km) to other services which may be used regularly for Western Region counties
Source: CSO, 2019 https://www.cso.ie/en/releasesandpublications/ep/p-mdsi/measuringdistancetoeverydayservicesinireland/ Statbank Table MDS02
The need for car travel is partly a function of the distances to be travelled but it also relates to difficulty accessing public transport. The average distance to a train station and a public bus stop (which in all Western Region counties is less than the average distance to a train) is shown in Figure 4 below. For most of these counties, these distances are greater than most people are likely to be able or wish to walk, especially given the hazards of walking on many rural roads, and the probability that many of the journeys in winter would not be in daylight.
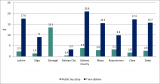
Figure 4: Average distance to a bus stop and train station in Western Region counties (km)
Source: CSO, 2019 https://www.cso.ie/en/releasesandpublications/ep/p-mdsi/measuringdistancetoeverydayservicesinireland/ Statbank Table MDS02
Note: Average distance to a train station is not shown for Donegal as there is no station in that county and the distance is too large for the chart (113km).
Even if people are to walk this distance (active travel modes in rural areas will be considered in a future post) many of these bus stops have very few services. All counties have even greater average distances to train stations and in certain situations (e.g. for work or business and hospital appointments) travelling by train may be a preferred option.
Of course levels of service are very important. Figure 5 below shows the percentage of the population whose nearest Public Transport stop has a low service frequency. This gives a clear indication of why so few rural journeys are by public transport (again to be discussed in a later post).
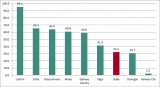
Figure 5: Percentage of the Population in Western Region counties whose nearest Public Transport stop has a frequency of fewer than 10 services per day.
Source: CSO Ireland, 2019, Measuring distance to everyday services 2019 Table 2.3 (XLS 14KB)
People not travelling
Finally, having discussed the reason people are making journeys and some of the issues for them in rural areas, it is also interesting to examine, in as far as the data allows, the journeys not made. The CSO’s National Travel Survey briefly examines the distribution of persons travelling and not travelling by degree of urbanisation and found that over 77% of persons residing in rural (thinly populated) areas took a journey on the travel reference day. This was an increase of over eight percentage points on 2014. By comparison, nearly two thirds (65.9%) of persons living in intermediate density areas and 71.1% of residents of urban (densely populated) areas made journeys on the travel reference day. At a regional level the survey shows that in the Border region 58.4% travelled on the reference day (which was the lowest regionally) and in the West 74.1% travelled. Nationally 71.3% travelled on the reference day.
The most common reason why people did not travel on the reference day was that they had no wish or need to travel or were fully occupied with home duties – nearly two thirds of persons (62.8%) gave this as their main reason for not taking a journey. Understanding more about why people don’t travel could be important in helping us consider how we reduce people’s need to travel on some occasions as a part of the ‘Avoid, Shift, Improve’ approach to developing more sustainable transport.
Conclusion
This post, the second in a series on transport data and issues for rural areas and the Western Region, examines some of distance to services, access to public transport and highlights some information on journeys not made. The next posts in this series will look at the length of journeys, travel time and the mode of transport. The collation and analysis of the available data will allow us better understand the reasons for, and nature of, rural journeys, This is essential to design policies to reduce emissions and help us to meet our transport targets as well as developing develop more sustainable rural transport options.
Helen McHenry
[1] There are eleven pieces of research and studies which are counted as ‘Steps Necessary for Delivery’ of Action 160, including the one to be carried out by the WDC “Study of transition to a low carbon economy: impacts for the rural western region”.