

Introduction
On Sunday 18th April 1926 the first Census of Population to take place following independence, and the establishment of the Irish Free State, was conducted. To make the detail of this 1926 Census available to the public one hundred years later, this weekend the National Archives will be releasing the digitised returns from that Census, with the completed forms will be available and searchable online. There is more information about this here and a very interesting short video on the process of digitisation here.
To celebrate the centenary of the first national census the Western Development Commission (WDC) has prepared an infographic showing some of the population changes in the Western Region since 1926 (Fig 1).
Fig 1 What’s changed in the Western Region since 1926: An infographic
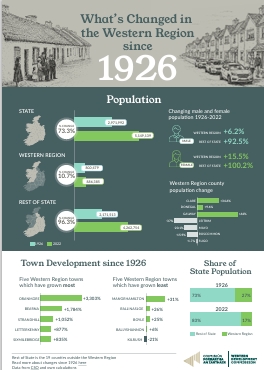
Download the infographic here
In this post I look into the data in a little more detail, focussing on the Western Region (the seven counties under the WDC remit: Clare, Donegal, Galway, Leitrim, Mayo, Roscommon and Sligo) and changes in town sizes since 1926. The data discussed comes from the CSO data platform and so gives a broad overview rather than the detail which will be available from the individual returns when they are released (18th April).
The post compares data from the 1926 Census with that from the most recent Census in 2022. The 1926 Census form was simpler than what we have become used to in recent years, though it had two parts, one of which was completed by the enumerator. Fig 2 shows an image of a blank Part A Census form.
Fig 2: Blank 1926 Census form, Part A
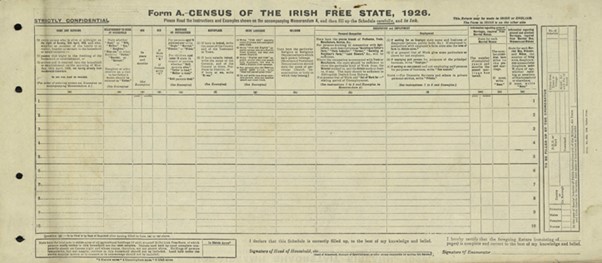
The focus in this post is on the basic population data collected in Part A, that completed by the householder.
County Population change
The population of the State has grown by 73% since 1926, but this growth has not been evenly spread. Indeed, despite very significant recent population growth, five counties still have fewer people living in them than they did in 1926 (Leitrim, Mayo, Roscommon, Sligo and Cavan). Four of these are in the Western Region which has shown much slower population growth since 1926, with an overall population increase of just 10.7% compared to a 96.3% increase in the Rest of the State (the 19 counties outside the Western Region).
This in turn impacts share of population. As can be seen in Fig 3, in 1926 Western Region counties accounted for 27% of the population of the State, whereas by 2022 they accounted for just 17%.
Fig 3: Share of State population in the Western Region, 1926 and 2022
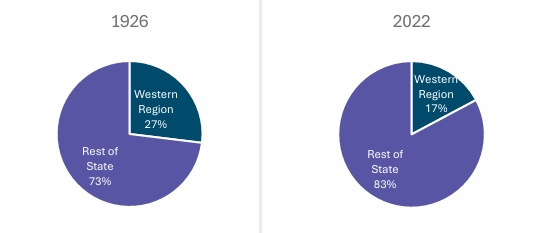
Data from CSO and own calculations
While the population of three Western Region counties is still well below that in 1926 (Leitrim 37% lower, Mayo 20% lower and Roscommon 16% lower) other Western Region counties grew more significantly, with the population of Galway 64% more than in 1926, and Clare 35% higher, while Donegal had almost 10% more people in 2022 than in 1926.
Counties in other parts of Ireland (Fig 4), especially in the east, have shown much greater growth, with Kildare (327% higher population in 2022 than 1926), Meath (251%) and Dublin (188%) showing the largest population increases since 1926.
Figure 4: County Population Change 1926-2022
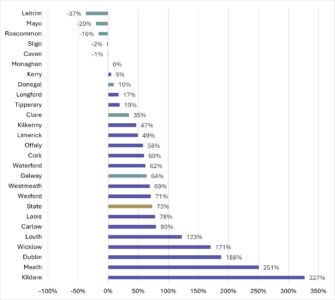
Data from CSO and own calculations
The difference in population size across the Western Region counties between 1926 and 2022 is very evident in Fig 5 below, with the significant growth in Galway standing out in comparison to the population decline compared to 1926 in four of the seven counties.
Fig 5: population of Western Region counties 1926 and 2022
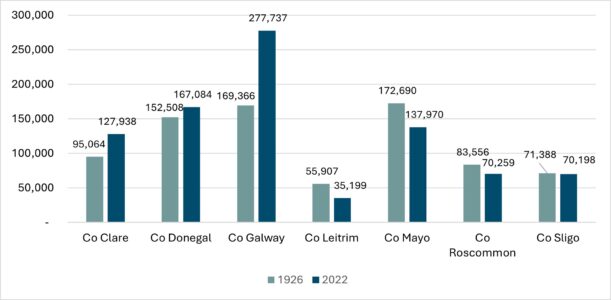
Data from CSO
Looking at data from 1926 and 2022 only provides a snapshot of the population changes in the Western Region counties, so it is interesting to see how population changed during that period (Fig 6). Although the population of three of the counties is now larger than in 1926, all counties showed population decline from 1926 until 1971 when the population of Clare and Galway grew for the first time since 1841 . Donegal, Mayo, Roscommon, and Sligo showed population increases in the 1979 Census, but Leitrim only showed its first population increase since 1841 in 2002
Fig 6: County population change over time from 1926-2022
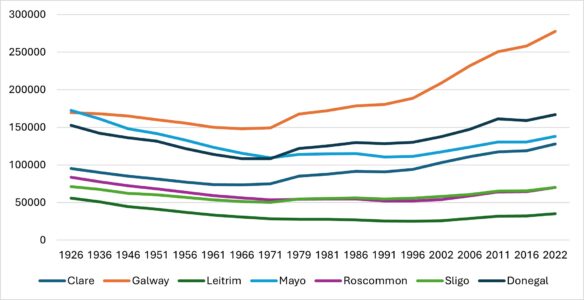
Data from CSO
Population growth has not, however, been steady during this period. Six of the seven Western Region counties showed population declines between 1986 and 1991 (Galway was the exception) while Donegal and Mayo both showed population decline between 2011 and 2016.
Population growth has also varied among males and females in the Western Region counties (Fig 7), with the female population in all counties either growing by more (Donegal, Sligo, Galway and Clare) or declining by less (Roscommon, Mayo and Leitrim) than the male population.
Fig 7: Male and female population change between 1926 and 2022
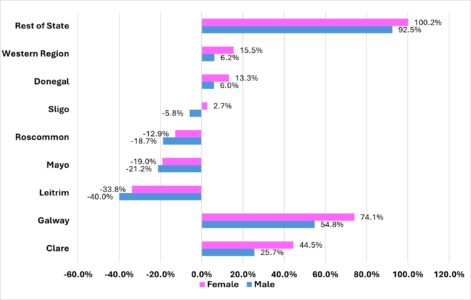
Data from CSO and own calculations
There are a number of factors which could influence these differences, including perhaps higher levels of male emigration (there seems to be very little analysis of this available), while the more significant increase in female life expectancy would also have some effect. Life expectancy at birth in Ireland 1926 was 57.4 years for males and 57.9 years for females. By 2016 this had improved to 79.6 years for males and 83.4 years for females.
Town Population Change
Town populations for 1926 have previously been published and it is interesting to look at the varied patterns of growth among the towns in the Western Region, and how the 1926 towns sizes compare with those in 2022.
Table 1 below shows the population of Western Region towns which were larger than 1,500 in 2022 (and hence classified as urban). The fastest growing are mostly dormitory towns around Galway, Sligo and Limerick, although Letterkenny showed exceptional growth too with an increase from 2,308 in 1926 to 22,549 in 2022. Interestingly, in 1926 Buncrana (2,307 in 1926) was the same size as Letterkenny, while Ballyshannon (2,112) was almost the same. In the last century while Letterkenny grew by 877%, the population of Buncrana grew by 202% (to 6,971 in 2022) and Ballyshannon has struggled to maintain population with only 6% growth between 1926 and 2022 (2,246 in 2022), the second lowest for a Western Region town.
Kilrush was the only Western Region town to show a population fall during the period (-21% from 3,345 in 1926 to 2,649 in 2022). Killaloe, another Clare town, grew more slowly (+84%) than most Western Region towns (904 to 1,666), while Ennis, the largest town in that county showed substantial growth of 406% from 5,518 to 27,923 in 2022.
Table 1: Town Populations in the Western Region 1926 and 2022
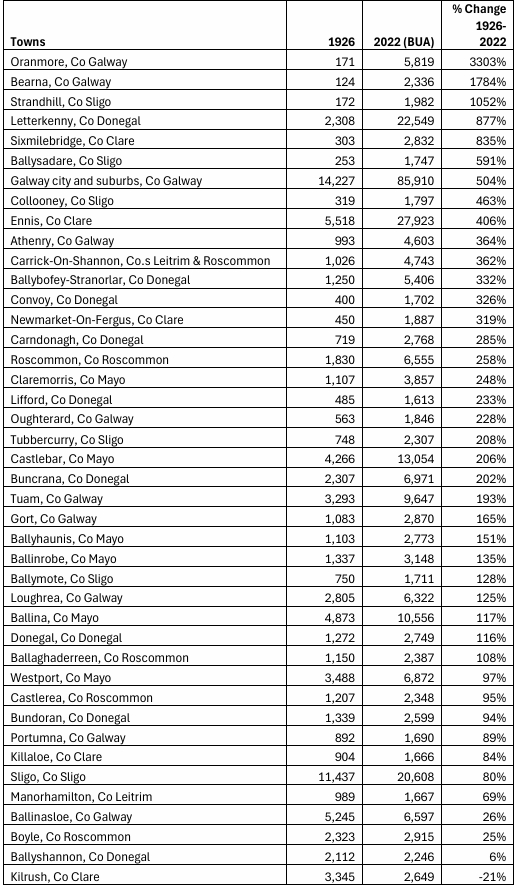
Source: CSO, C_1926_V10_Chapter_Appendix_D towns in alphabetical order and Census of Population 2022
The pattern was different in Sligo, with the county town growing from 11,437 in 1926 to 20,608 (+80%) in 2022, but this was outpaced by other towns in the county, with Collooney growing from 319 to 1,797 in 2022 (+463%) and Ballysadare growing from 253 in 1926 to 1,747 in 2022 (+591%).
In Leitrim, despite the very substantial population decline since 1926 discussed above, both Carrick on Shannon (+362%) and Manorhamilton (+69%) showed population growth. Similarly in Mayo, where the 2022 population is lower than that in 1926, the towns grew with Claremorris growing fastest (348%) and Castlebar outpacing Ballina to become the largest town in that county over the period.
In county Roscommon in 1926 Boyle was the largest town in the county (at 2,323), but population growth in Boyle has been one of the lowest in the Region (25%) while Roscommon town has grown substantially (by 258%) to 6,555 and is now the largest in the county
Galway city has also grown substantially, (from 14, 227 in 1926 to 85,910 in 2022 (504%)). This contrasts with Ballinasloe which had a population of 5,245 in 1926 and by 2022 had a population of 6,597 (a 26% increase).
With town population changes varying from a 21% decline to a 3,303% growth, the rates and reasons for growth are many and varied and too complex for this blog post.
Conclusion
The 1926 Census also collected basic information about the residents of each household including religion, Irish language ability and occupation. Unfortunately the categories are not easily comparable with 2022 data. For example, the definition of ‘Irish speaker’ is very broad and it would be difficult to know if we were comparing similar levels of spoken Irish. Occupation data from 1926 is fascinating, with data on many occupations that no longer exist or have changed substanitally (for example there were 1,413 Cartwrights, Coachbuilders, Wheelwrights working in the Region), but again it would be difficult to make a meaningful comparison to 2022 without considerable recategorization and explanation. For those interested, though, it can be done at ED and county level.
While there is a significant amount of data from 1926 not covered here, this blog has looked at some of the population changes in the Western Region since 1926, and it has been interesting to consider the differences among the Western Region counties in terms of population growth and town growth. This post has had a county focus but the release of the returns from the 1926 Census (on 18th April 2026) gives us the opportunity to get a sense of the individuals who were enumerated in Census 1926. You can see where and how grandparents, great grandparents and great, great grandparents were recorded, their occupations and levels of spoken Irish. If your home is old enough you can also find out who was living there, and how it was described.
Helen McHenry
If you found this post interesting, you might like to read one I wrote some time ago that looks back further, examining changes in the Western Region population since 1841 (but makes comparisons with the 2016 Census). It is here