
In this final post on regional Gross Value Added (GVA) data, the focus is on the role of different sectors in our regions. As discussed in the previous post, the economic contribution of the regions is related to the size of the population and the workforce, but also to the strength of different sectors in each region. This is examined, followed by a discussion on the importance of each region in national sectoral GVA and finally, although this data has only been available for the last two years, I take a brief look at the changes in Regional GVA for sectors for 2015 and 2016. As before, there is a main focus is on the Border and West regions as they are the regions most aligned with the WDC’s Western Region[i].
The importance of different sectors in each region
It is useful to examine the importance of different sectors in each region and in Figure 1 the contribution of each sector to the individual region’s GVA is shown. As noted in the previous blog posts on this topic (here and here), the data for the Mid West and South West regions was supressed by the CSO to preserve the confidentiality of some large Multi National Entities (MNE). I have, therefore, inferred the data for a combined region (Mid West & South West) so that it can be included here. Strikingly, in the combined in the combined region of the Mid West & South West the significance of GVA from Industry[ii] is evident (accounting for an extraordinary 64% of the total GVA in this combined region). This compares to 36% of GVA nationally. Industry is also particularly important in the Mid East (36% of GVA) and the West (35% of GVA).
The largest sector in the Border region is Pubic administration, heath and education[iii] (26% of GVA) and this is also the largest sector in the Midlands (27% of GVA) as well as being an important sector in the West (20%) and the South East (16%). Unsurprisingly, the largest sector in GVA terms in Dublin is Information and communication.
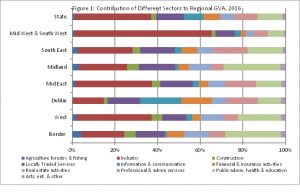
Source: CSO, 2019, County Incomes and Regional GDP Table 9d
Looking at other sectors, Agriculture forestry and fishing contributed most to GVA in the Border region (4% of GVA) and accounts for 3% of Midlands GVA. These figures somewhat underestimate the importance of this sector as the processing element of this sector is included with Industry. The Agri-food sector therefore makes a greater contribution to the economy than shown here (estimated as 7% of GVA nationally, compared to 1% in this data). Additionally, economic activity in the agriculture and food sector is derived from a much higher proportion of Irish inputs (74%) than other traded sectors (43%). See here for discussion.
In 2016 the most important sectors in the economy of the Border region are Public administration, health and education (26%), Industry (20%) and Locally[iv] traded services (14%). As noted above, Industry accounts for more than a third of the economy of the West (35%), Public administration, health and education accounts for 20% and Locally traded services and Real estate activities both contributed 11%.
The size of GVA from each sector varies significantly (see Figure 2), with Industry the most significant sector (nationally 36% of all GVA), followed by Locally traded services (13%), Public administration, health and education (12%); Professional and administrative services (11%) and Information and communications (9%).
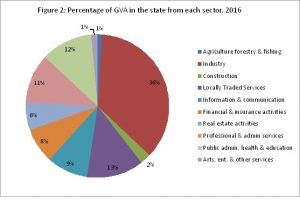
Source: CSO, 2019, County Incomes and Regional GDP Table 9d
Key sectors in the regions
While it is very useful to look at which sectors are most important to each region, (as above in Figure 1) but it is also interesting to see which region are most important to different sector’s total GVA (Figure 3 below). As discussed in the last post on this topic, the regions are very different sizes, in terms of population and persons at work as well as in terms of economic output. It is important to remember this when looking at contributions from each region (especially Dublin and the combined region of Mid West & South West).
While, as noted above, Industry is very significant in GVA of the combined region Mid West and South West, this is turn translates into this region accounting for a very significant proportion of GVA from Industry (Figure 3) in all regions, close to two thirds of all GVA from Industry in Ireland (62%). In contrast, Dublin, which is the largest region in terms of population, persons at work and GVA, only accounts for 16% of Industrial GVA (see Figure 3).
Dublin clearly accounts for the highest proportion of GVA in all other sectors (with the exception of Agriculture, forestry and fishing). It is however, completely dominant in Information and Communication, accounting for 82% of all the GVA of that sector.
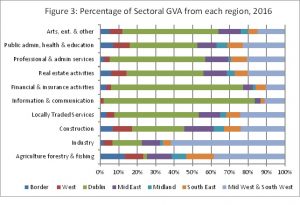
Source: CSO, 2019, County Incomes and Regional GDP Table 9d,
As noted, the size of the different sectors should be borne in mind, but it is also interesting to consider relative importance of the different regions (the Border and West in particular) contribution to national GVA in that sector. Looking at the Border region, Agriculture (14%), Construction (7%), Public administration, health and education (7%) and Real estate activities are the sectors where the Border contributes more than 5% of each Sector’s GVA.
Although manufacturing is important in the West (the high value added medical device sector has a globally significant cluster), the significance of the sector in the Mid West & South West in this means the West only produces 5% of sectoral GVA, even though this is the largest sector in that region accounting for more than a third of all GVA (Figure 2 above). The West contributes more than 5% of national GVA in the Agriculture (10%), Construction (10%), Real estate (10%), Public administration (9%) and Arts, entertainment and other services (7%).
Changes over Time
Data on regional sectoral GVA has only been available for the last two years so it is not possible to look back at changes over the longer term. It is, however, interesting to look at the difference between 2015 and 2016, bearing in mind that the data is very volatile across these two years.
It is difficult to say how much of this volatility relates to the factors underlying the level shift in GVA in 2015 (read more about this here) but it appears to apply in all sectors when looking at growth and decline across regions (Table 1). Because we can only look at the change between 2015 and 2016, it is important not to place too much significant on the changes but, the significant volatility is evident at a glance. In the table all declines are highlighted in pink with declines in GVA of more than 20% in bright red. Growth of more than 10% is shown in pale blue and growth of more than 15% and 25% is shown in darker blues. Both Construction and Financial and insurance activities grew significantly in all regions, while Industry, Information and communication and Arts, entertainment and other services each grew in some regions while declining in others.
Table 1: Changes in regional sectoral GVA 2015-2016
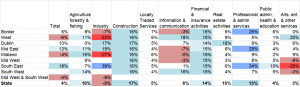
Source: CSO, 2019, County Incomes and Regional GDP Table 9d, 9e (own calculations)
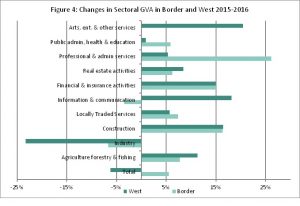
Looking more closely at the Border and West regions (Figure 4), it is clear that while there was growth in most sectors the growth rates was often different in the two regions, for example in Professional and administrative services GVA in the Border grew by 26% and only by 5% in the West. In contrast, Arts, entertainment and other services grew by 20% in the West and showed no growth in the Border region. GVA from Industry fell in both regions (-23% in the West and -7% in the Border region) and while Agriculture, forestry and fishing grew in the Border region (6%) it fell in the West region (-6%).
Source: CSO, 2019, County Incomes and Regional GDP Table 9d, 9e
As noted above, this detailed data on sectoral GVA for the NUTS 3 regions have only recently been calculated. It was published last year (2018) for the first time in relation to 2015, and this year 2016 data is available. In future years it will be very useful to be able to examine trends over a longer period in relation to regional sectoral growth. This will also be important to increasing our understanding of regional productivity issues as well as the different rates of economic growth and development across regions. This post has been the first opportunity to consider this in more detail, but I look forward to continuing the analysis next year.
Helen McHenry
[i] Clare is the only Western Region county not in these regions. Clare is part of the Mid West, for which data has been suppressed.
[ii] Mining and quarrying; manufacturing; electricity, gas, steam and air conditioning supply; water supply; sewerage, waste management and remediation activities.
[iii] Public administration and defence; compulsory social security; education; human health and social work activities
[iv] Wholesale and retail trade; repair of motor vehicles and motorcycles; transportation and storage; accommodation and food service activities