
The Western Development Commission (WDC) has just published SMI 24 – The Sustainable Mobility Index 2024 for Rural Towns in Ireland’s Western Region[1] . This updates the first Sustainable Mobility Index (SMI 22) and uses 2024 data along with data from Census 2022. In this blog I give a brief overview of SMI 24 but all the details and link to download are to be found on this page.
Rural towns, which lie in between larger urban centres and countryside, can sometimes be overlooked, considered neither truly rural nor truly urban. The SMI gives useful insights into mobility in rural towns in the Western Region and provides a starting point for examining many wider questions about mobility in these towns and offers a wealth of detail on patterns of travel and the current availability of services[2] and facilities.
Recognition of these towns’ role in mobility for all rural areas prompted the development of the SMI. Given our focus on rural areas in this index, and at the same time the necessity of having clearly defined areas to compare, the Index was prepared for 40 rural towns in the seven counties in the Western Region with a population between 1,500 and 10,000[3] as shown on the map below (Figure 1). As a result of population growth measured in Census 2022 five more towns have been included in SMI 24 than SMI 22 (Baile Chláir (Claregalway), Ballysadare, Killaloe, Oughterard and Portumna).
Figure 1: Towns in the Sustainable Mobility Index 2024
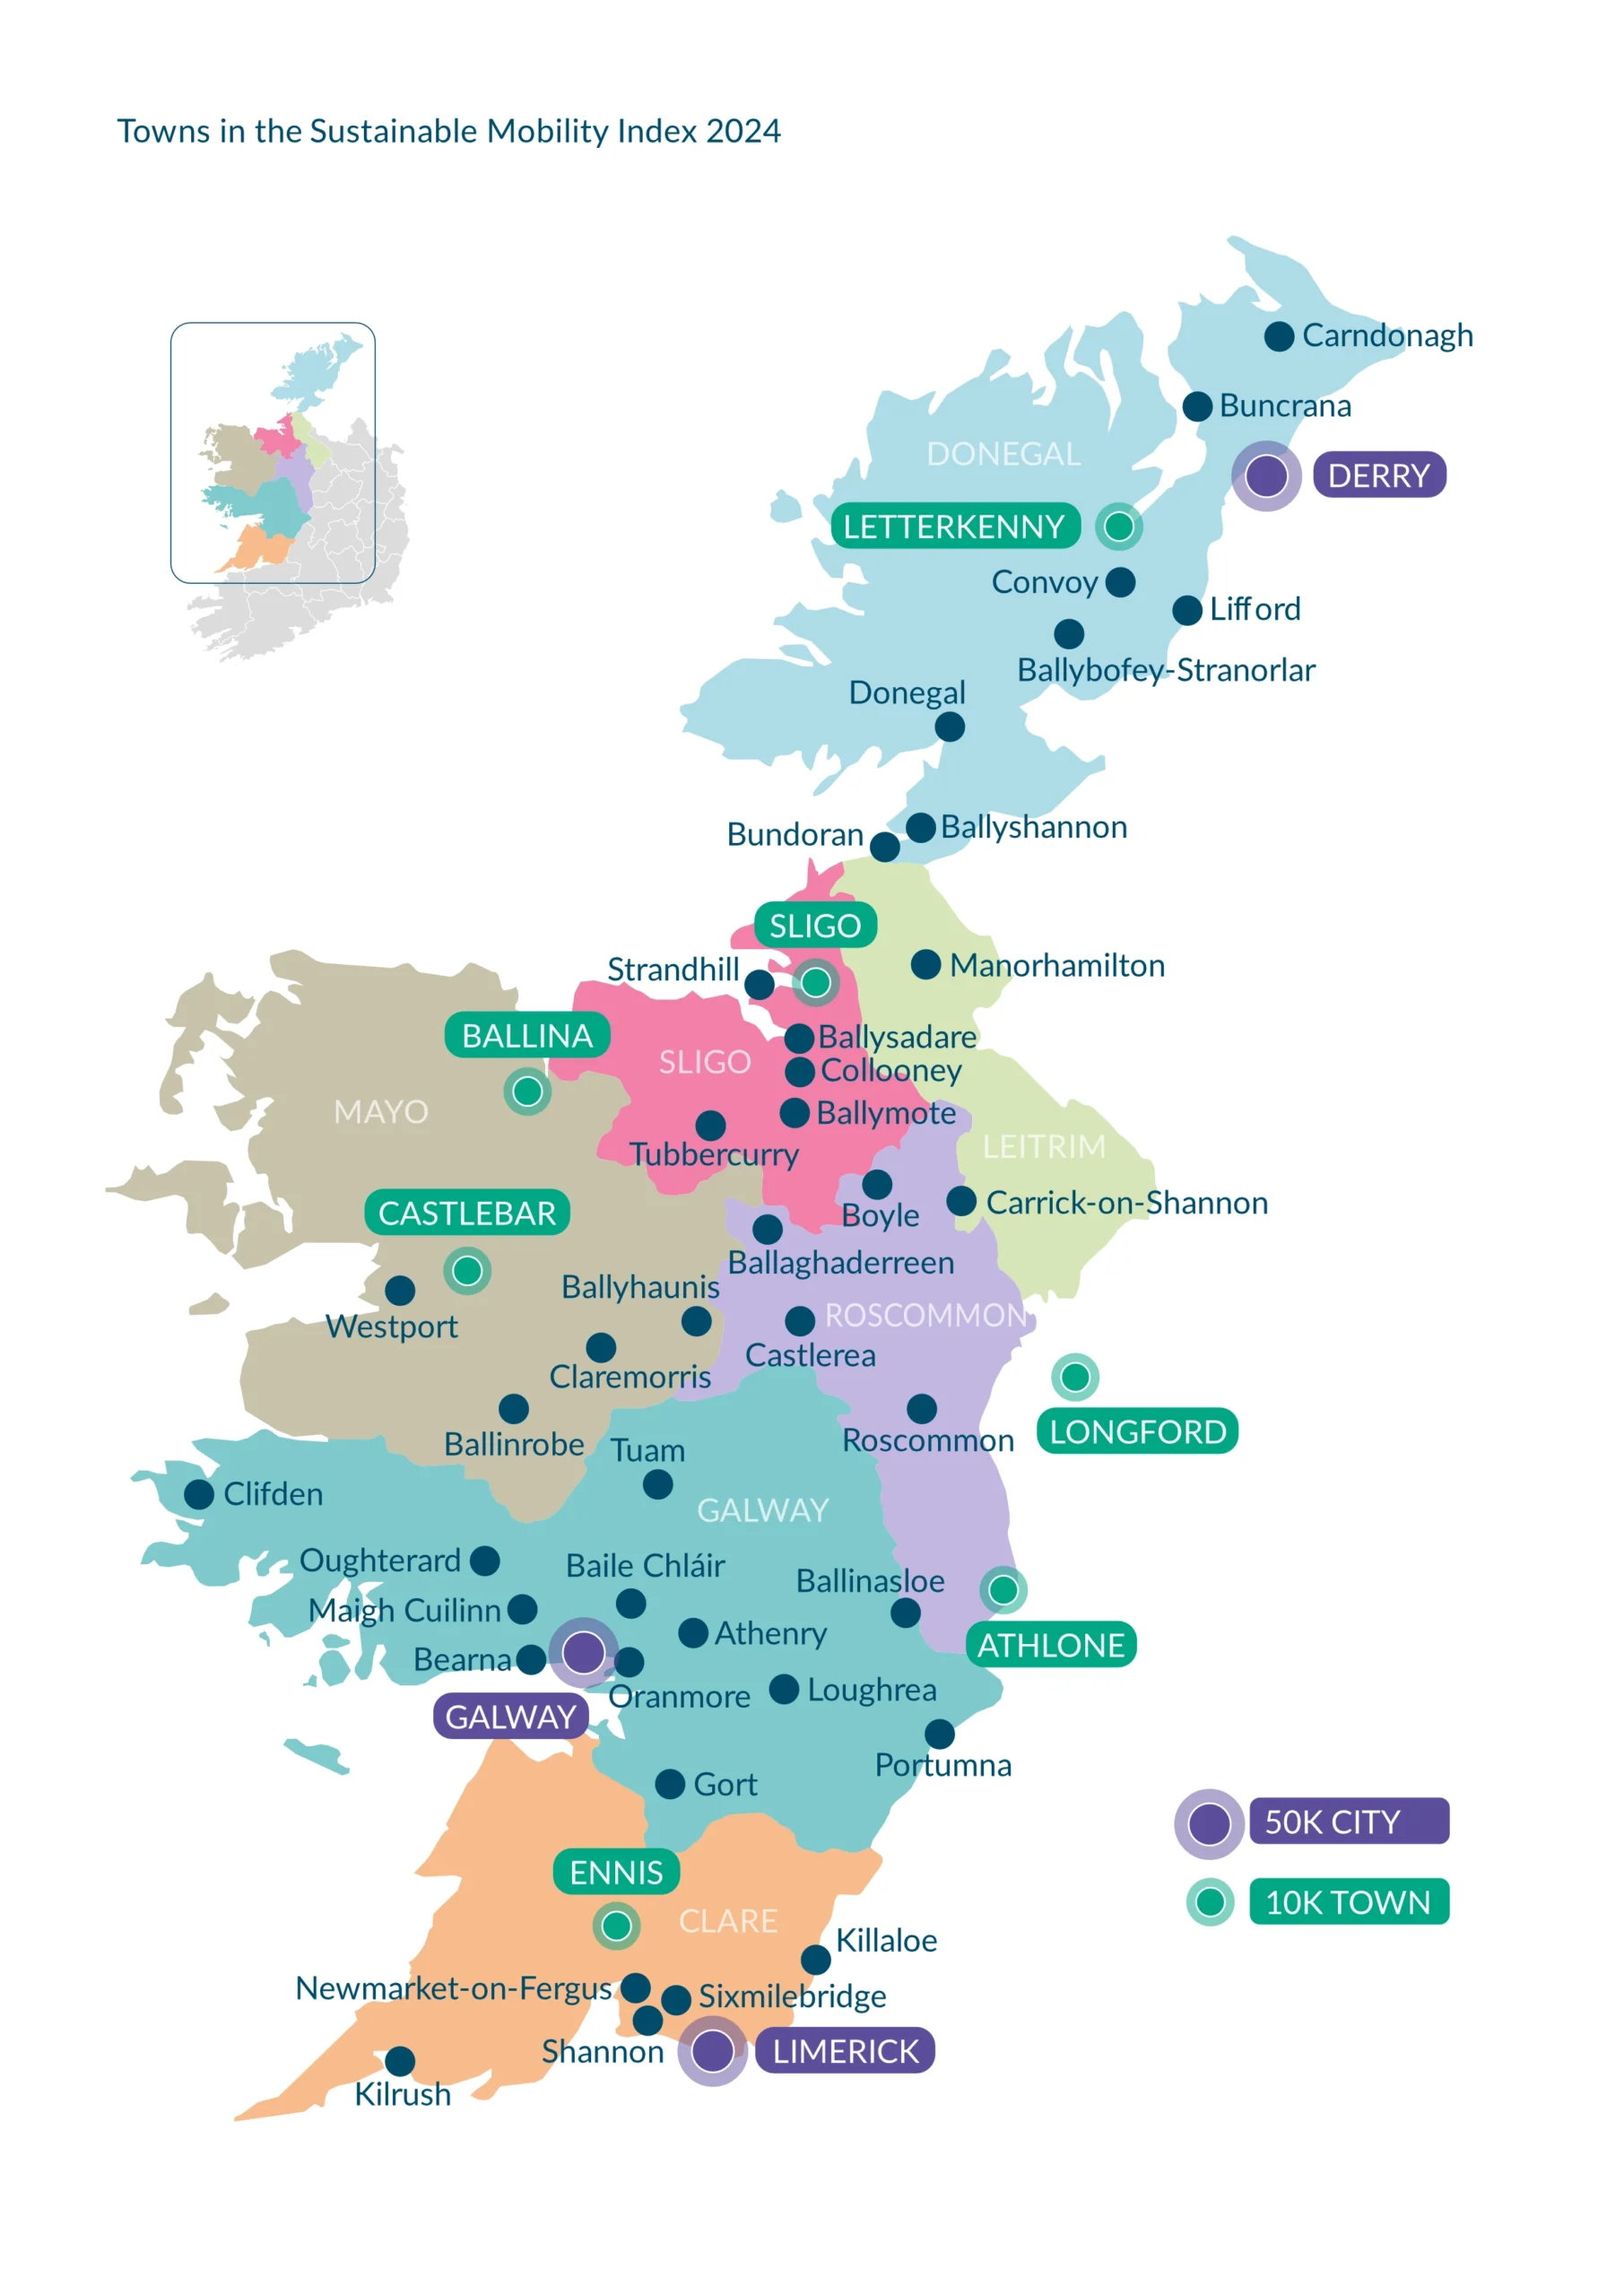
The Index covers 12 towns from Galway, 8 from Donegal, 5 from Sligo and Clare, 4 each Roscommon and Mayo and 2 from Leitrim. Of the 40 towns in SMI 24 two of these are outside of the population category (Clifden, which now has a population less than 1,500 and Shannon which is larger than 10,000 people)[4]. Both were retained in the Index to allow for comparison with SMI 22.
The Index is based on 30 indicators covering different modes, infrastructures and services for people in the 40 towns. To provide better insights and comparisons the Index is broken down into three themes. Each of these themes is each based on 10 indicators reflecting key areas for which good mobility is essential. These are:
1. Readiness for the Low Carbon Transition (LCT)
2. Access to Services and Social Facilities (S&S)
3. Access to Employment and Economic opportunities (E&E)
These three themes allow for comprehensive comparative analysis across the various towns and show changes since SMI 22. LCT has a focus on low carbon transition and a strong emphasis on active travel, while indicators for public transport services for the towns make up most of the indicators under S&S and E&E.
Individual indicators scores, along with the definitions and details of data collection and sources are available in Part 2 of this report. If you are interested in a particular town, all of the information for that town, along with background information on the town, is provided in an infographic format in Part 3.
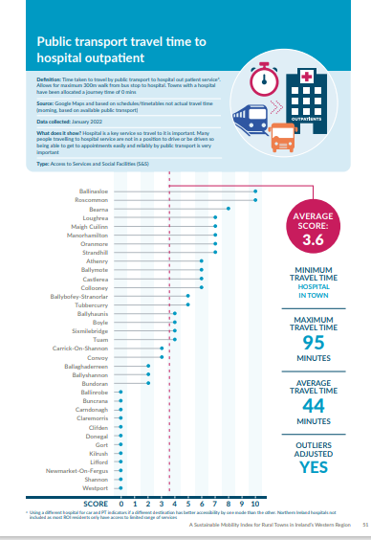
A page of detail for each indicator is shown in part 2 of the report. Figure 2 below shows an example of the page for the public transport to hospital services indicator.
Figure 2: Sample Indicator Page
What does the Sustainable Mobility Index show?
The Index has a focus on public transport and active travel as well as other indicators of sustainable mobility[5]. It allows for comparison between towns in the region, among similar towns and with SMI 24 we can measure mobility changes that take place and how towns improve in relation each other.
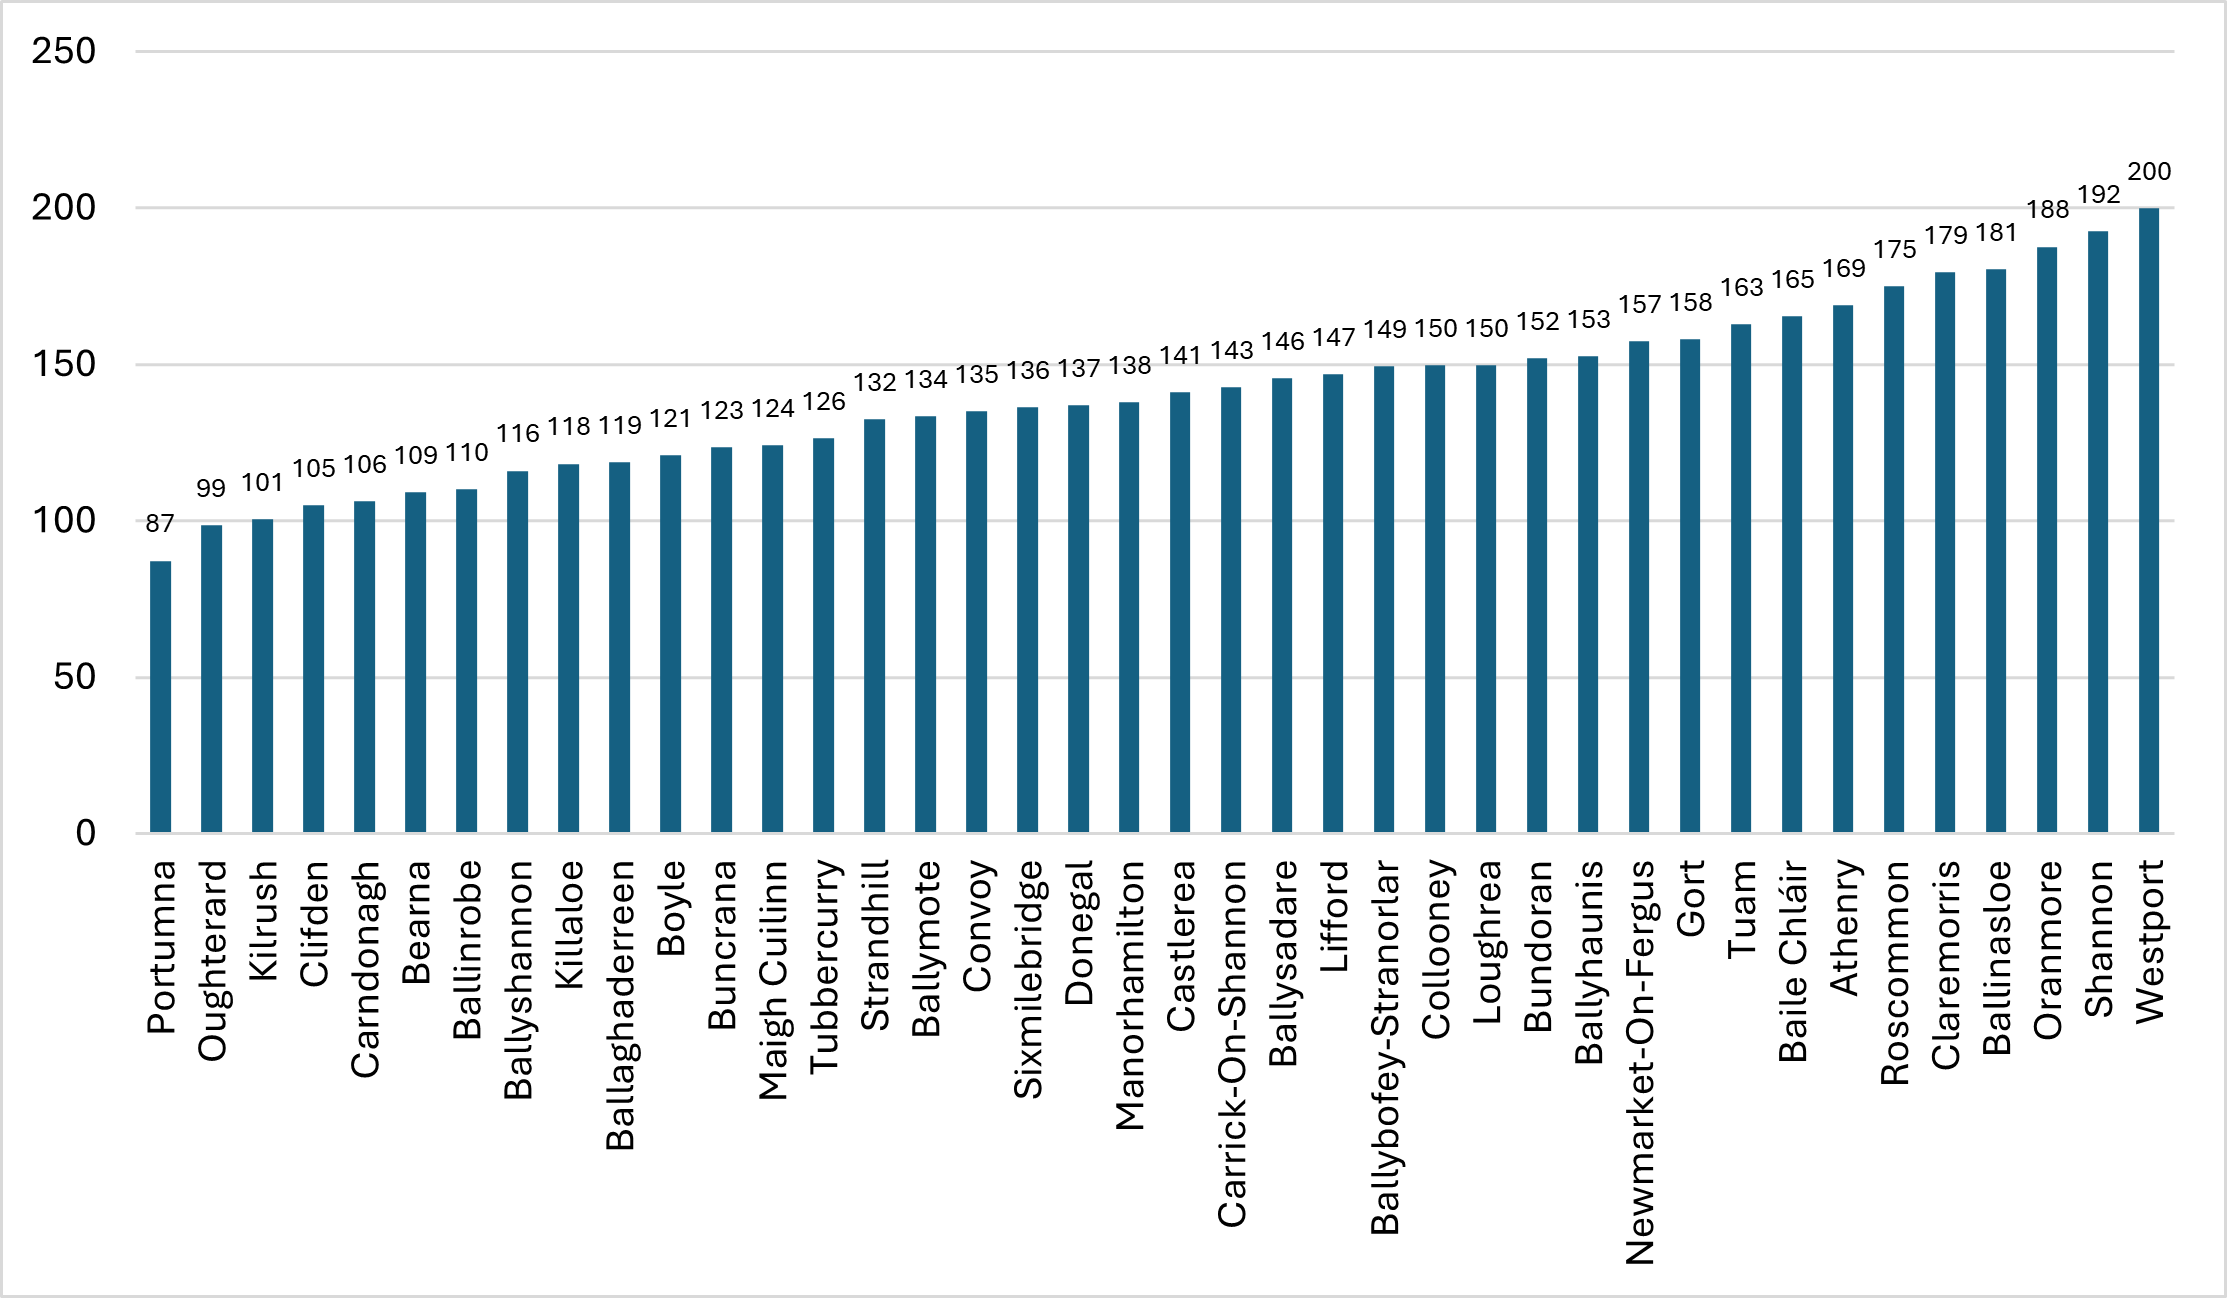
Westport, Co. Mayo had the highest score in SMI 24 followed by Shannon, Co. Clare and Oranmore, Co. Galway. At the other end of the scale, the Galway towns of Portumna and Oughterard, both of which are new to the Index, scored lowest (see Figure 3).
The top five towns are in three different counties, there are two from Galway, the county with most towns in the index (12 of 40), two from Mayo and one from Clare. Likewise, the five lowest scoring towns are from three different counties (one each from Donegal and Clare and three from Galway).
Figure 3: Town scores in SMI 24
Some key findings include:
- Towns score well not just because of their location, but also because of investments made, and effective planning and good public transport provision.
- Improvements in public transport (including better services to hospitals and universities) has helped some towns climb the rankings.
- Often the highest income towns tended to show less public transport use and had higher car ownership.
- Some of the best scoring towns are a key service centres for a large hinterland or are local centres of employment with high job to population ratios.
- The cost of using public transport to access to 10k towns varies substantially, this is not just related to distance, but type of service and provider also have an impact
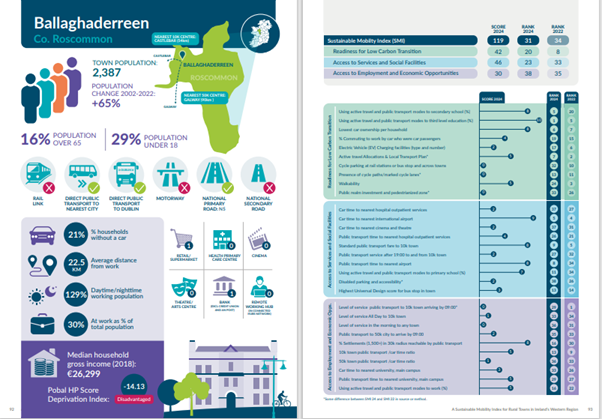
When examining results, it is important to understand the different characteristics and functions of the towns. Therefore a ‘town profile’ with 20 other indicators of town characteristics was also created. This is shown alongside the town SMI scores and ranks in Part 3 of this report. Figure 4 below gives an example for Ballaghaderreen.
Figure 4: Sample of town profile and SMI results
Comparison with SMI 22
Forty towns are included in SMI 2024 but only 35 were included in SMI 22 so only these 35 towns are considered for comparison (Figure 5). The rankings considered are 1-35 and the five towns new in SMI24 have been removed from the rankings for this discussion. As the SMI is a relative index only ranks (and not scores) are compared across the time periods.
Figure 5: Rank of 35 towns in SMI 24 and SMI 22
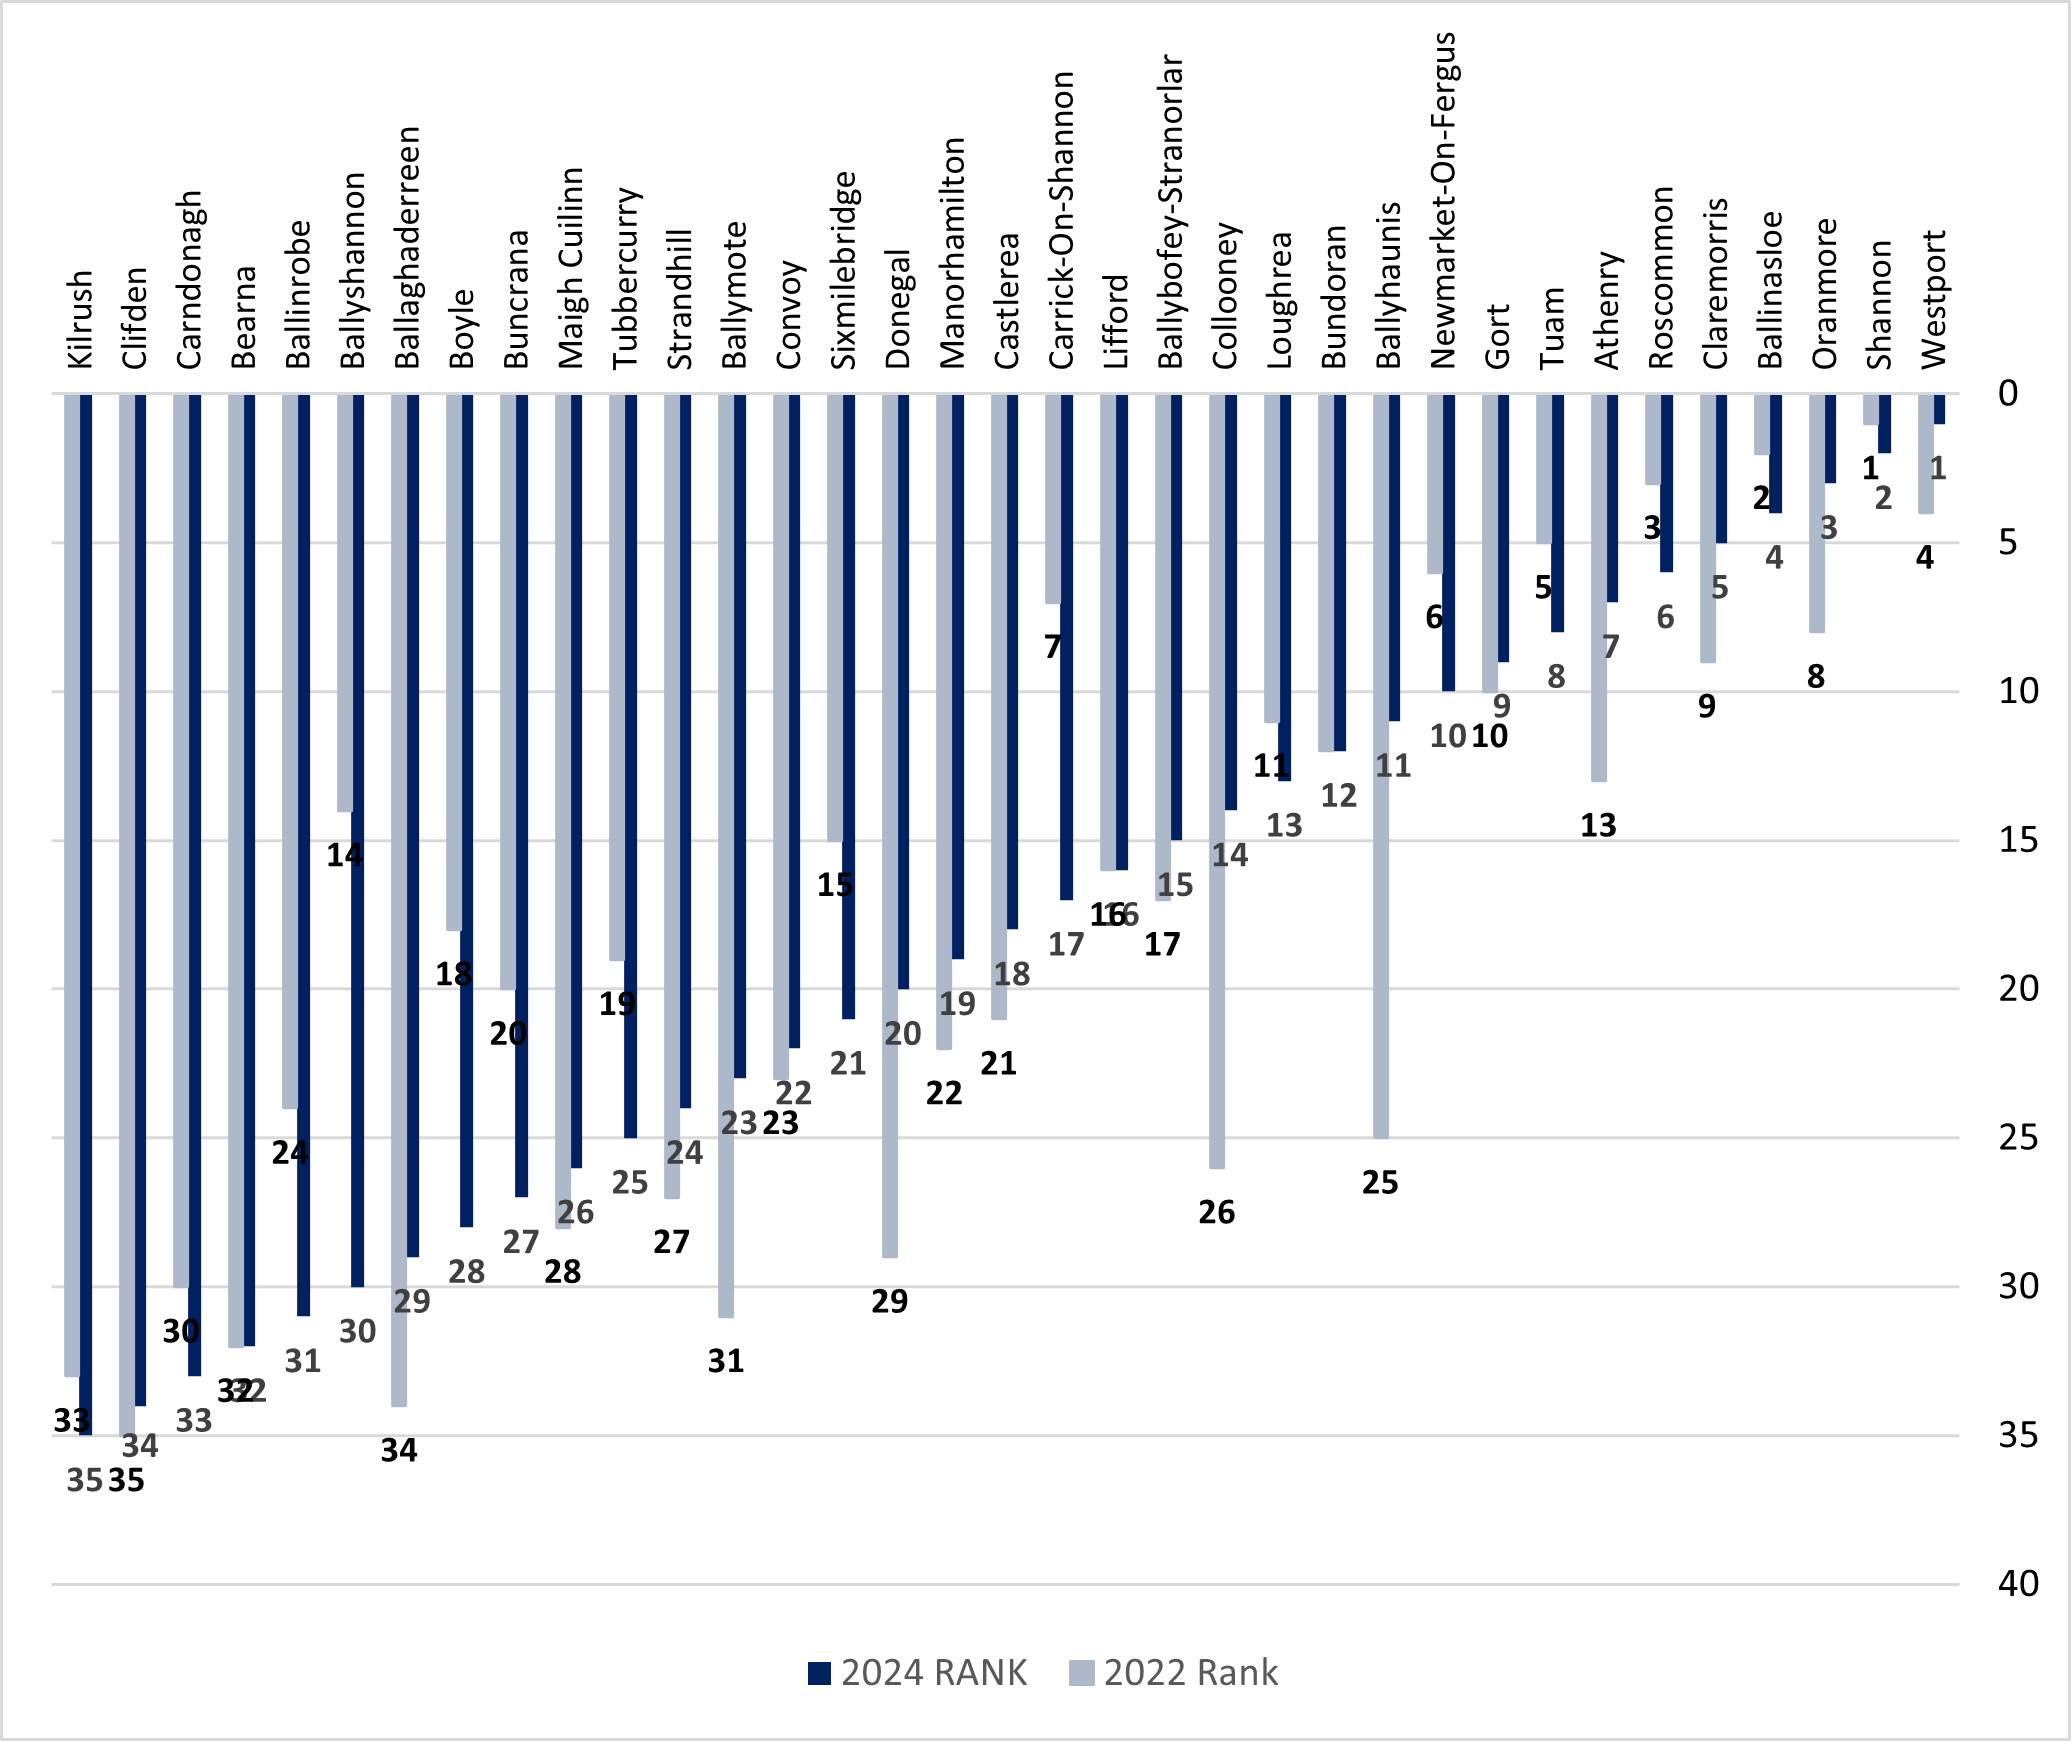
Ballyhaunis (up 14 places) and Collooney (up 12) along with Donegal (up 9) and Ballymote (up 8) have shown the most significant improvement in rank. At the other end of the SMI Ballyshannon (down 16 places) and Carrick on Shannon and Boyle (both down 10) had the most significant falls in ranking.
Conclusion
When we developed the SMI, the objective was to have a long- term relative measure of sustainable mobility in towns in the Western Region. There is a significant amount of data behind the SMI, and it is not possible to discuss it all but Parts 2 and 3 provide full detail.
The SMI was designed to help those providing transport, engaged in transport policy and in town development to determine what needs to be done and identify good practices. SMI 24 provides us with an opportunity to examine changes in sustainable mobility patterns in the region and to compare results with those in SMI 22. This helps improve our knowledge of Western Region town residents’ current mobility needs and how they align with developing policy.
It provides a useful high-level view of mobility patterns and services in the west of Ireland with interesting patterns emerging, for example in relation to public transport services and use, and local investments. With the emphasis on attracting more people to live in rural towns, improving mobility options and making the towns more active travel friendly are likely to be important areas for planning and investment in future.
Download the document, summary or town information here.
Helen McHenry
[1] The Western Region is the area under the Western Development Commission (WDC) remit. It covers seven counties: Clare, Donegal, Galway, Leitrim, Mayo, Roscommon and Sligo.
[2] At the time of data collection. This is noted for each indicator in Part 2.
[3] All population data quoted in this report are from the Census of Population 2022, unless otherwise stated.
[4] Clifden population was 1,259 in Census 2022 (using the new ‘Built Up Are’ (BUA) classification while the population of Shannon grew to 10,256
[5] There are also a number of indicators for car travel journey time to key services.