

Introduction
Economies change, with different sectors becoming more prominent over time, so it is interesting to look at these changes at a regional level. In this post on Gross Value Added (GVA) data, I look at the current (2023) importance of different sectors to the regions’ economies and changes in the last ten years.
Note on limitations of regional GVA
While regional GVA (and associated GDP[1]) is a key measure of how regions are performing, and provides an estimate of the size of the regional economy and its growth (or decline) over time, it is just one measure of regional development which, as a single measure, has significant limitations. For example, commuter flows may result in employees contributing to the GDP of one region (where they work), and employment measures and household income in another region (where they live). This drawback is particularly relevant when there are significant net commuter flows into or out of a region. Such regions often display regional GDP per capita that is very high when compared with surrounding regions. This pattern is seen in many metropolitan regions of the EU, but principally in capital cities and is very clearly displayed in Ireland, in Dublin, with strong commuter flows from the Mid East, Midlands, and South East. There are also commuter flows to Dublin from the eastern part of the Border region.
In addition to commuting, other issues such as the relocation to Ireland by significant Multi National Enterprises (MNEs) of some or all of their business activities and assets (in particular Intellectual Property) alongside contract manufacturing conducted abroad (which is included in Irish accounts) affect GDP figures. These are associated with the level shift in GDP in 2015 which clearly influenced shares of regional GVA and contributed to the widening disparity among regions’ GVA. See here for more discussion about regional issues and GVA, and papers from the NTMA and Fitzgerald at the ESRI for national GDP considerations and this Eurostat explainer for an EU perspective.
Despite these difficulties, however, GVA remains one of the most important regional economic statistics and is a key measure of regional development progress and it is useful to consider the contribution of the regional economies to the national total in more detail.
Note on the NUTS 3 regions being discussed.
As the Western Region[2] is made up of seven counties which are in three different NUTS 3 regions it is not possible to discuss Western Region GVA. The West region (Galway, Mayo and Roscommon) all lie within the WDC’s Western Region, while the Border comprises Cavan and Monaghan, along with Donegal, Sligo and Leitrim which are in the Western Region. This is important as economic characteristics of Cavan and Monaghan may be quite different from the northwestern part of the Border region, particularly in relation to greater integration with the Mid East and Dublin economies (for example providing workers commuting to those regions). Finally, Clare is only one of three counties in the Mid West, and again with GVA data it is difficult to know the level of contribution from that county to the Mid West regional economy.
Size of the regional economies
When considering the relative importance of sectors in our regions it is also necessary to remember that there are very significant differences in the economic size of the NUT3 regions.
Figure 1: Regional share of national GVA
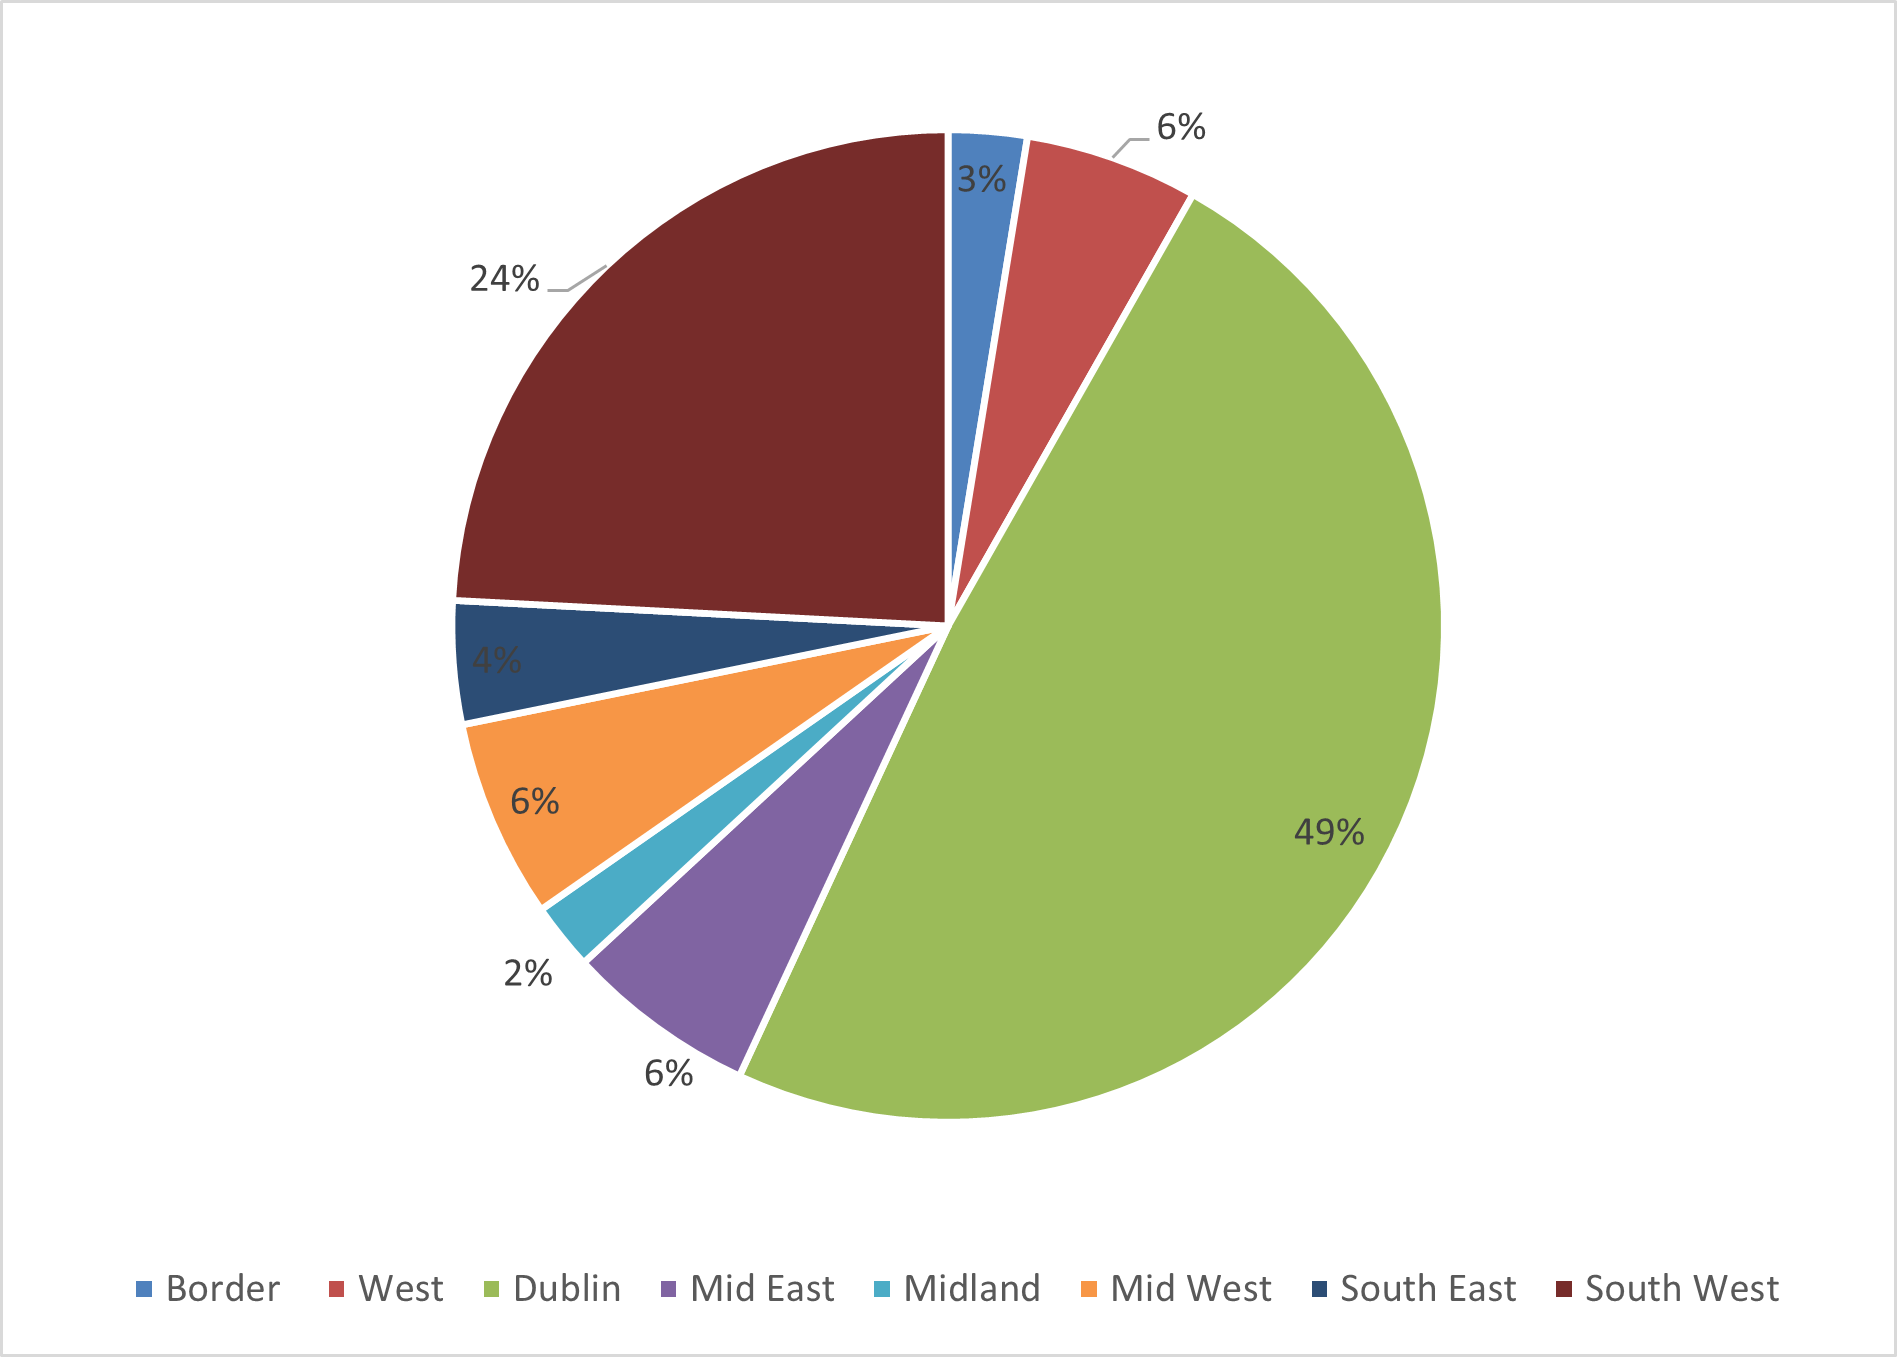
Source: CSO, 2025, County Incomes and Regional GDP 2023 Table 3.1
The regions discussed in this post (West, Border and Mid West) together only account for 15% of the national economy (Figure 1) or a total, from the three, of €71,219m in 2023, with the Border economy accounting for 3% of the national (€12,407m) (3%) and West and Mid West 6% each (€27,374m and €31,438m). These three NUTS 3 regions combine to cover 11 counties while the Western Region comprises 7 counties. The Western Region economy is therefore smaller than that discussed here, and accounts for somewhat less than 15% of national GDP.
Although the focus of this post is on the relative importance of different sectors (NACE A10 aggregation) to the regional economies, it is useful first to look at the relative importance of each regions contribution to the sectors at a national level (Figure 2).
Figure 2: Regional contribution to each economy sector
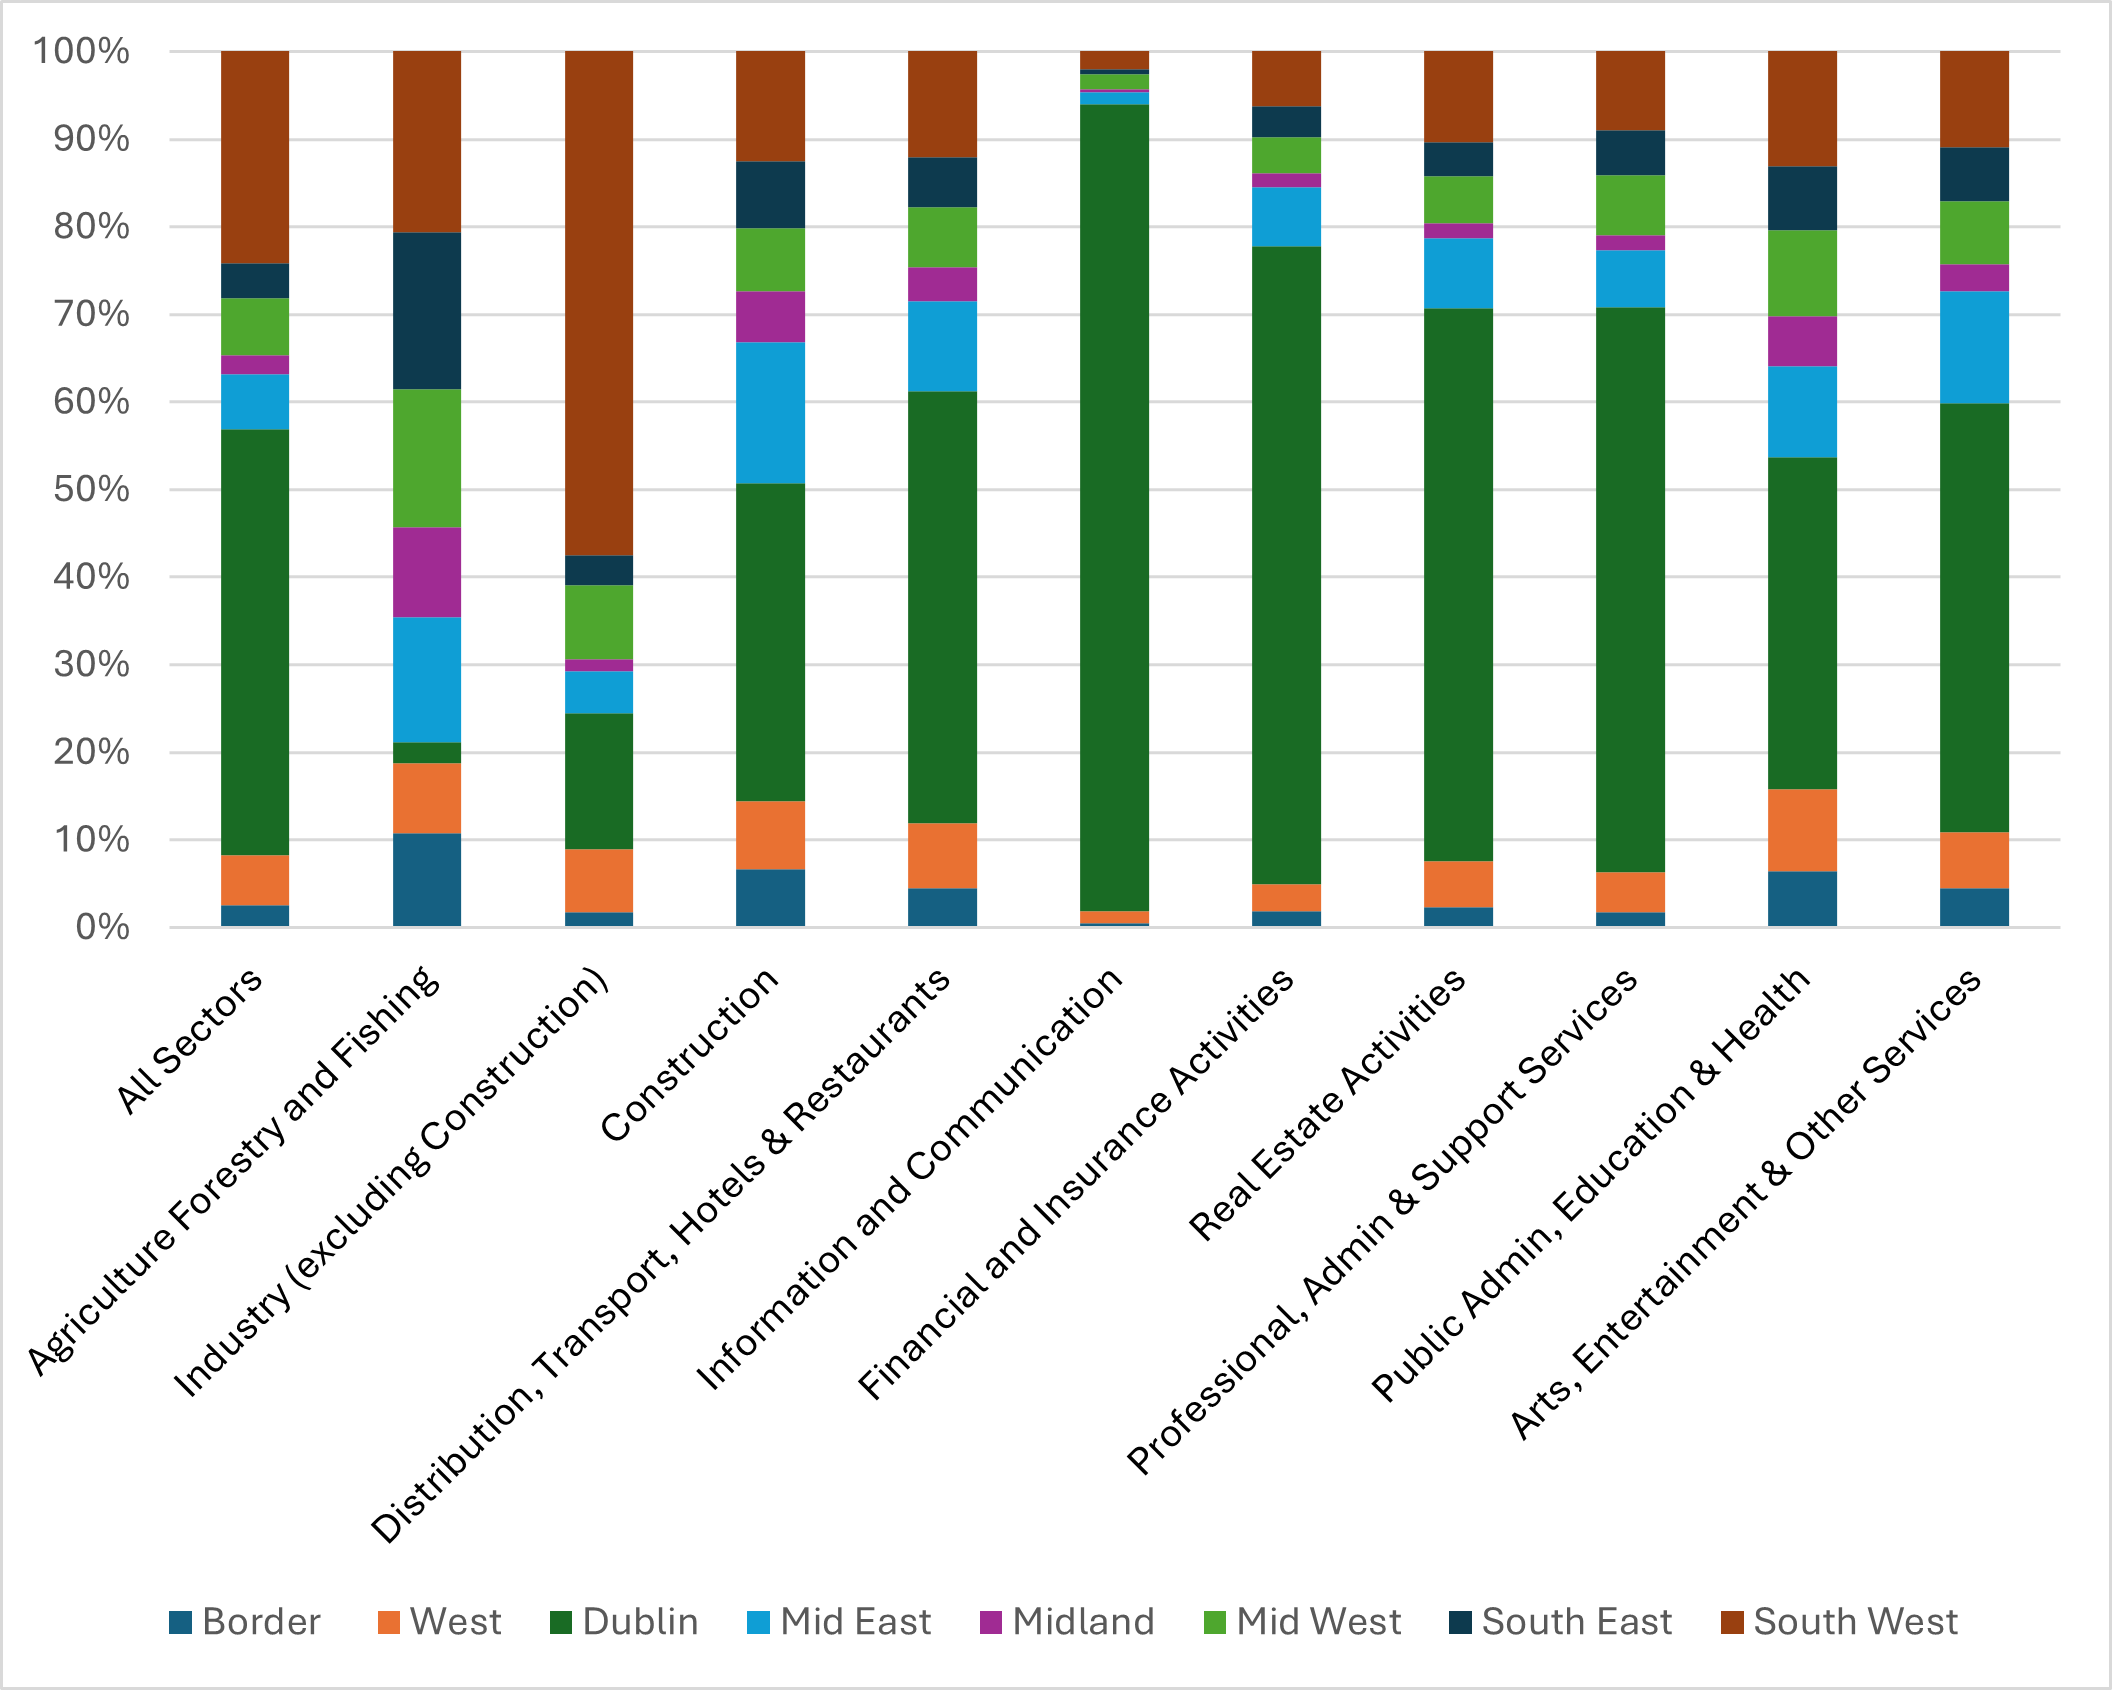
Source: CSO, 2025, County Incomes and Regional GDP 2023 Table 3.1
The dominance of Dublin in all sectors except Industry very clear. With many high value MNEs, the South West accounts for most of the Industry sector output (57% of the national total). Apart from Agriculture, Forestry and Fishing, where the share of output is relatively evenly spread (though it is only a small part of the economy in each region), the dominance of Dublin and the South West in other sectors is apparent.
The focus of this post, however, is on the sectoral composition of the regional economies, specifically the West, Border and Mid West regions and so Figure 3 shows the sectoral make up of each of the NUTS3 regional economies.
Figure 3: Sectoral Composition of the regional economies (2023)
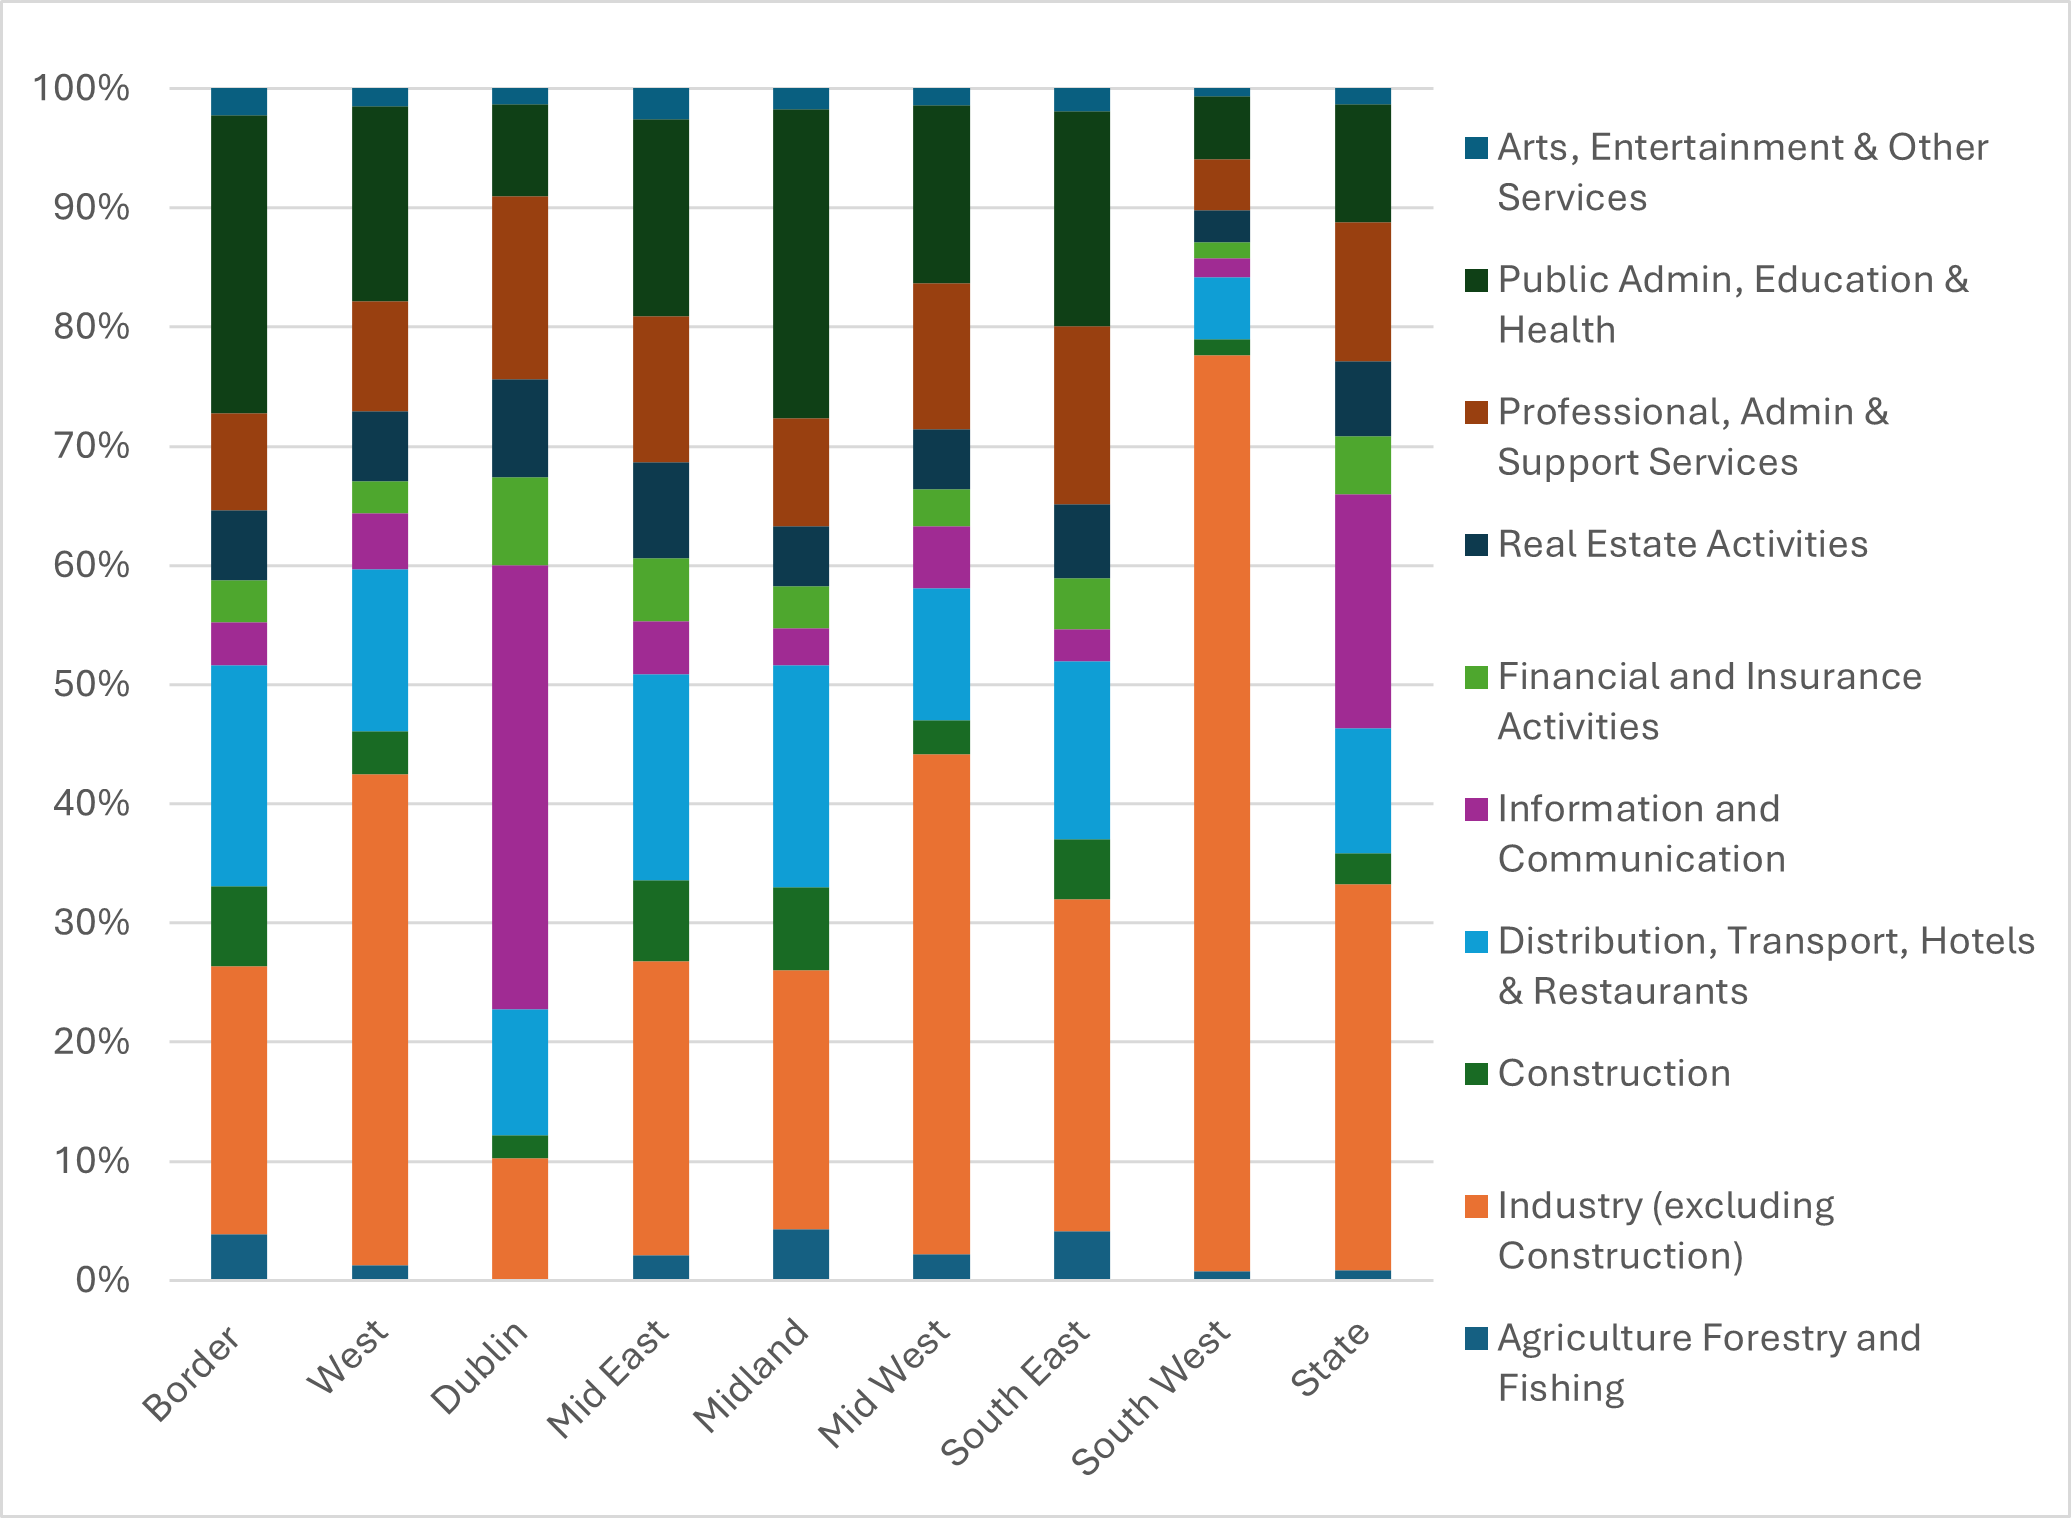
Source: CSO, 2025, County Incomes and Regional GDP 2023 Table 3.1
The importance of Industry to the South West economy is evident, accounting for 77 % of regional GVA, but industry is also the most significant sector in the economies of the West and Mid West, accounting or more than 40% of GVA in both those regions. In contrast, at 25% of total regional GVA, in the Border region Public Administration, Health and Education is the most significant sector.
Changing sectoral importance over time
Looking in more detail at the three regions which include counties from the Western Region, it is useful to compare changes in importance of sectors in the most recent ten years for which we have data (2014-2023). The focus here is particularly on changes in the high value sectors such as Professional, Scientific and Technical Activities; Administrative and Support Service Activities (a shorter version of this title is used throughout); Real Estate Activities, Financial and Insurance Activities and Information and Communications, as it is important that growth in these sectors is at a similar level to that in the Dublin/Mid East and South West regions, or there is potential for further widening of the gap between economies and, in turn incomes, among regions.
The West region
Considering the West region first, the results are mixed. The economy has grown in this period (by 123%) but the share coming from each sector has changed somewhat.
Figure 4: West: sectoral share of regional economy 2014, 2023
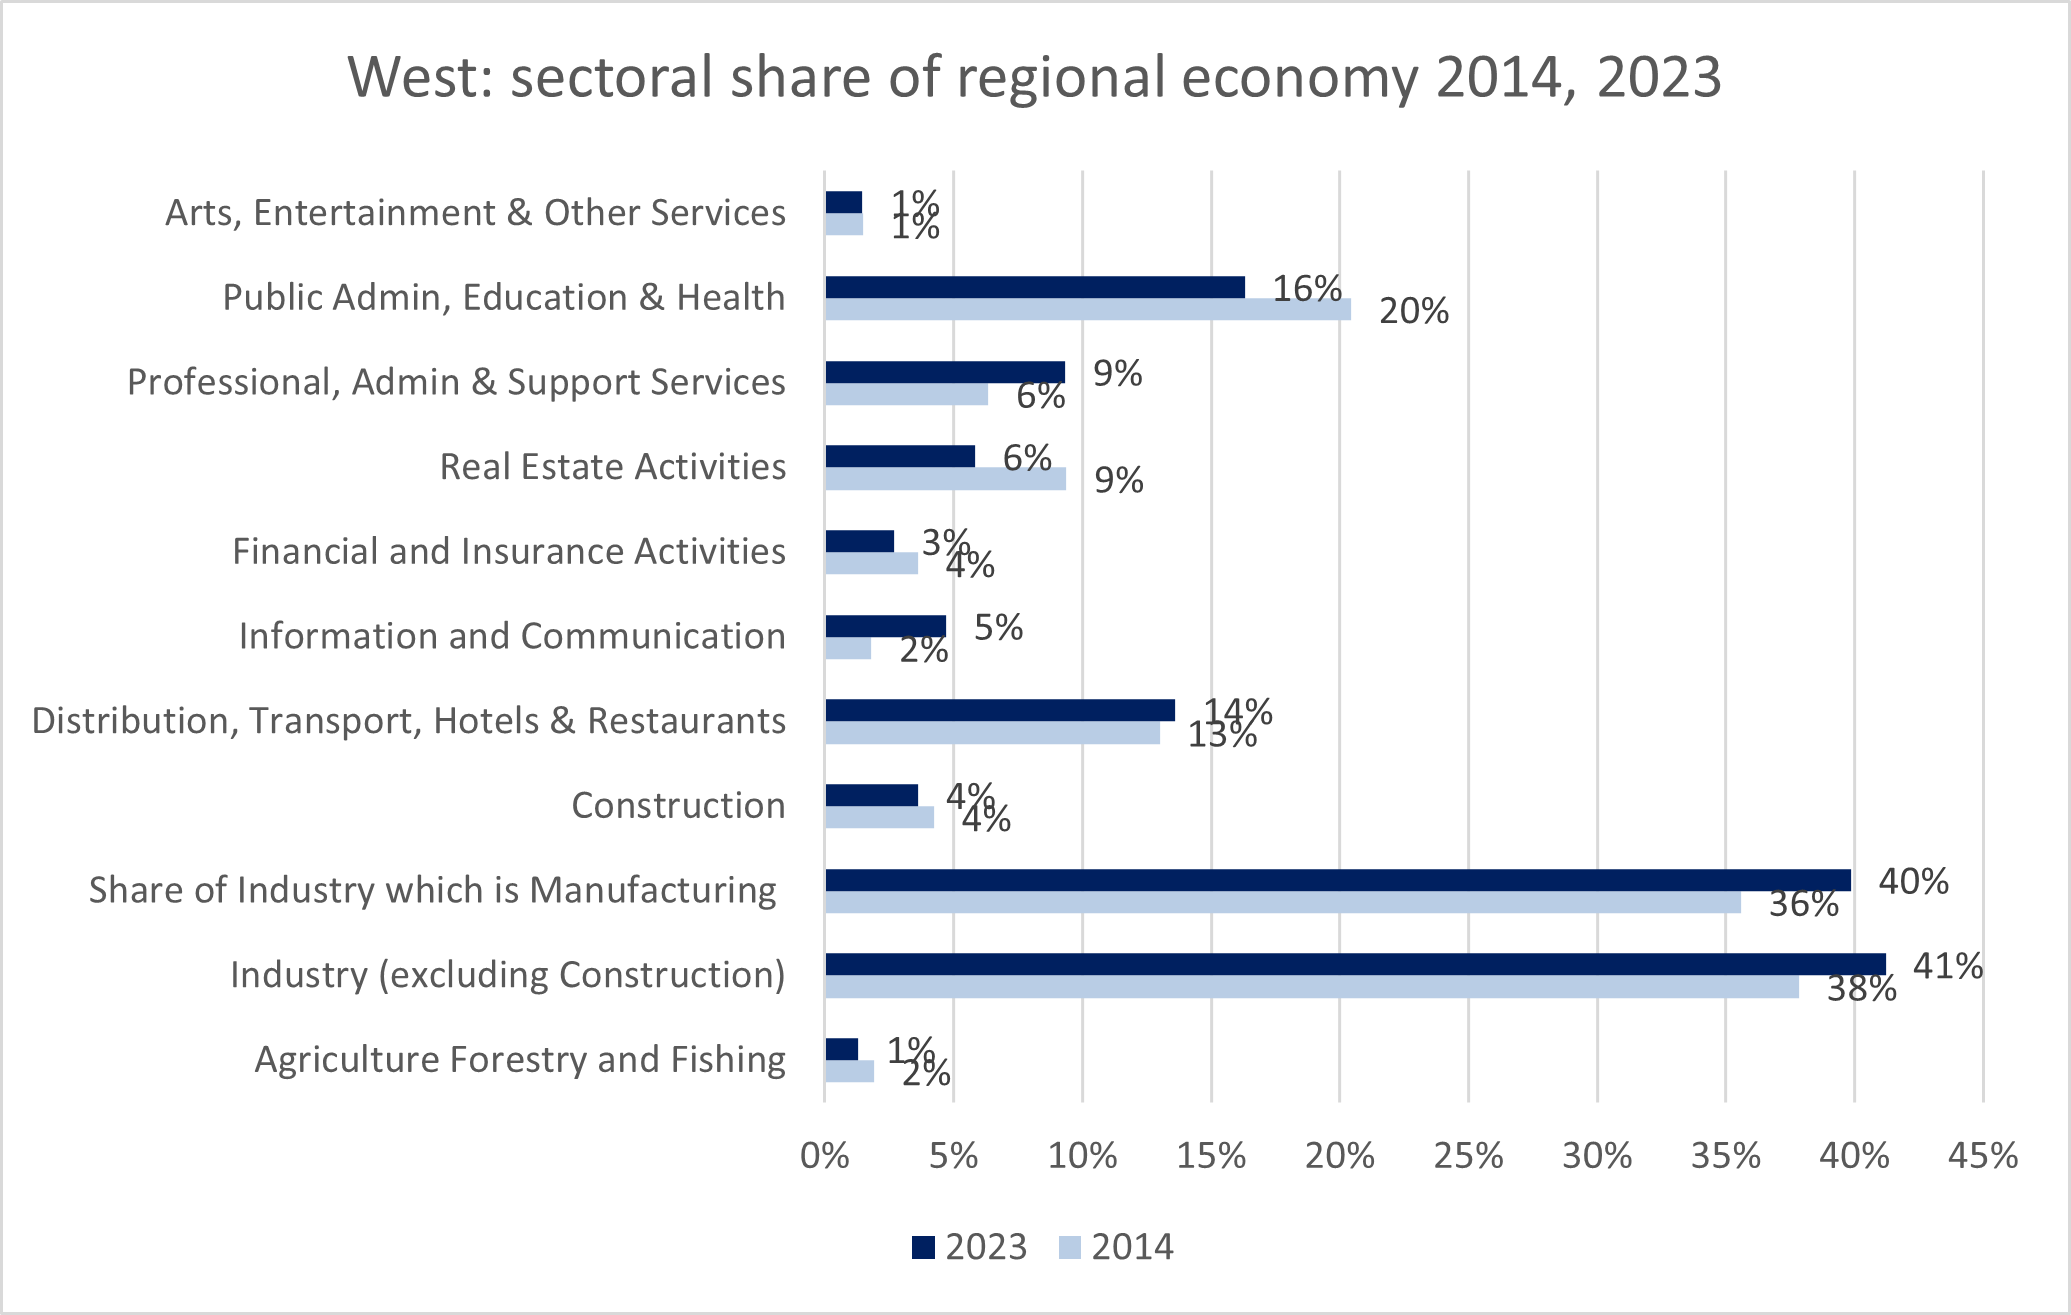
Source: CSO, 2025, County Incomes and Regional GDP 2023 Table 9e Gross Value Added by Sector 2014 and 2023 (own calculations)
In 2023 the most important sector was Industry (41%) made up mostly of Manufacturing (40%) but following that, relatively lower value sectors of Public Administration, Health and Education (16%) along with Distribution, Transport, Hotels and restaurants (14%) were the next most important sectors.
There have, however, been changes over time. In 2014 Industry accounted for 38% of the West regional GVA, and so has become slightly more important to the regional economy. Within Industry and manufacturing there is not enough detail available at a regional level to assess the contribution of high value manufacturing to this total. In that same time period, Public Administration, Health and Education has become somewhat less important (20% of GVA in 2014 but 16% in 2023). Professional, Administration and Support Services (9% in 2023 vs 6% in 2014) and Information and Communications (5% in 2023 vs 2% in 2014) are both have more significant share of regional GVA in 2023 than 2014.
The Border region
The economy of the Border region grew by 31% between 2014 and 2023, the lowest growth of any of the NUTS 3 regions (only the South East (51%) and Midland (93%)regions also grew by less than 100%). In the Border region, as noted above, Public Administration, Health and Education contributes for a quarter of regional GVA, but this is less than in 2014 when it accounted for 29% (Figure 5).
Figure 5: Border sectoral share of regional economy 2014, 2023
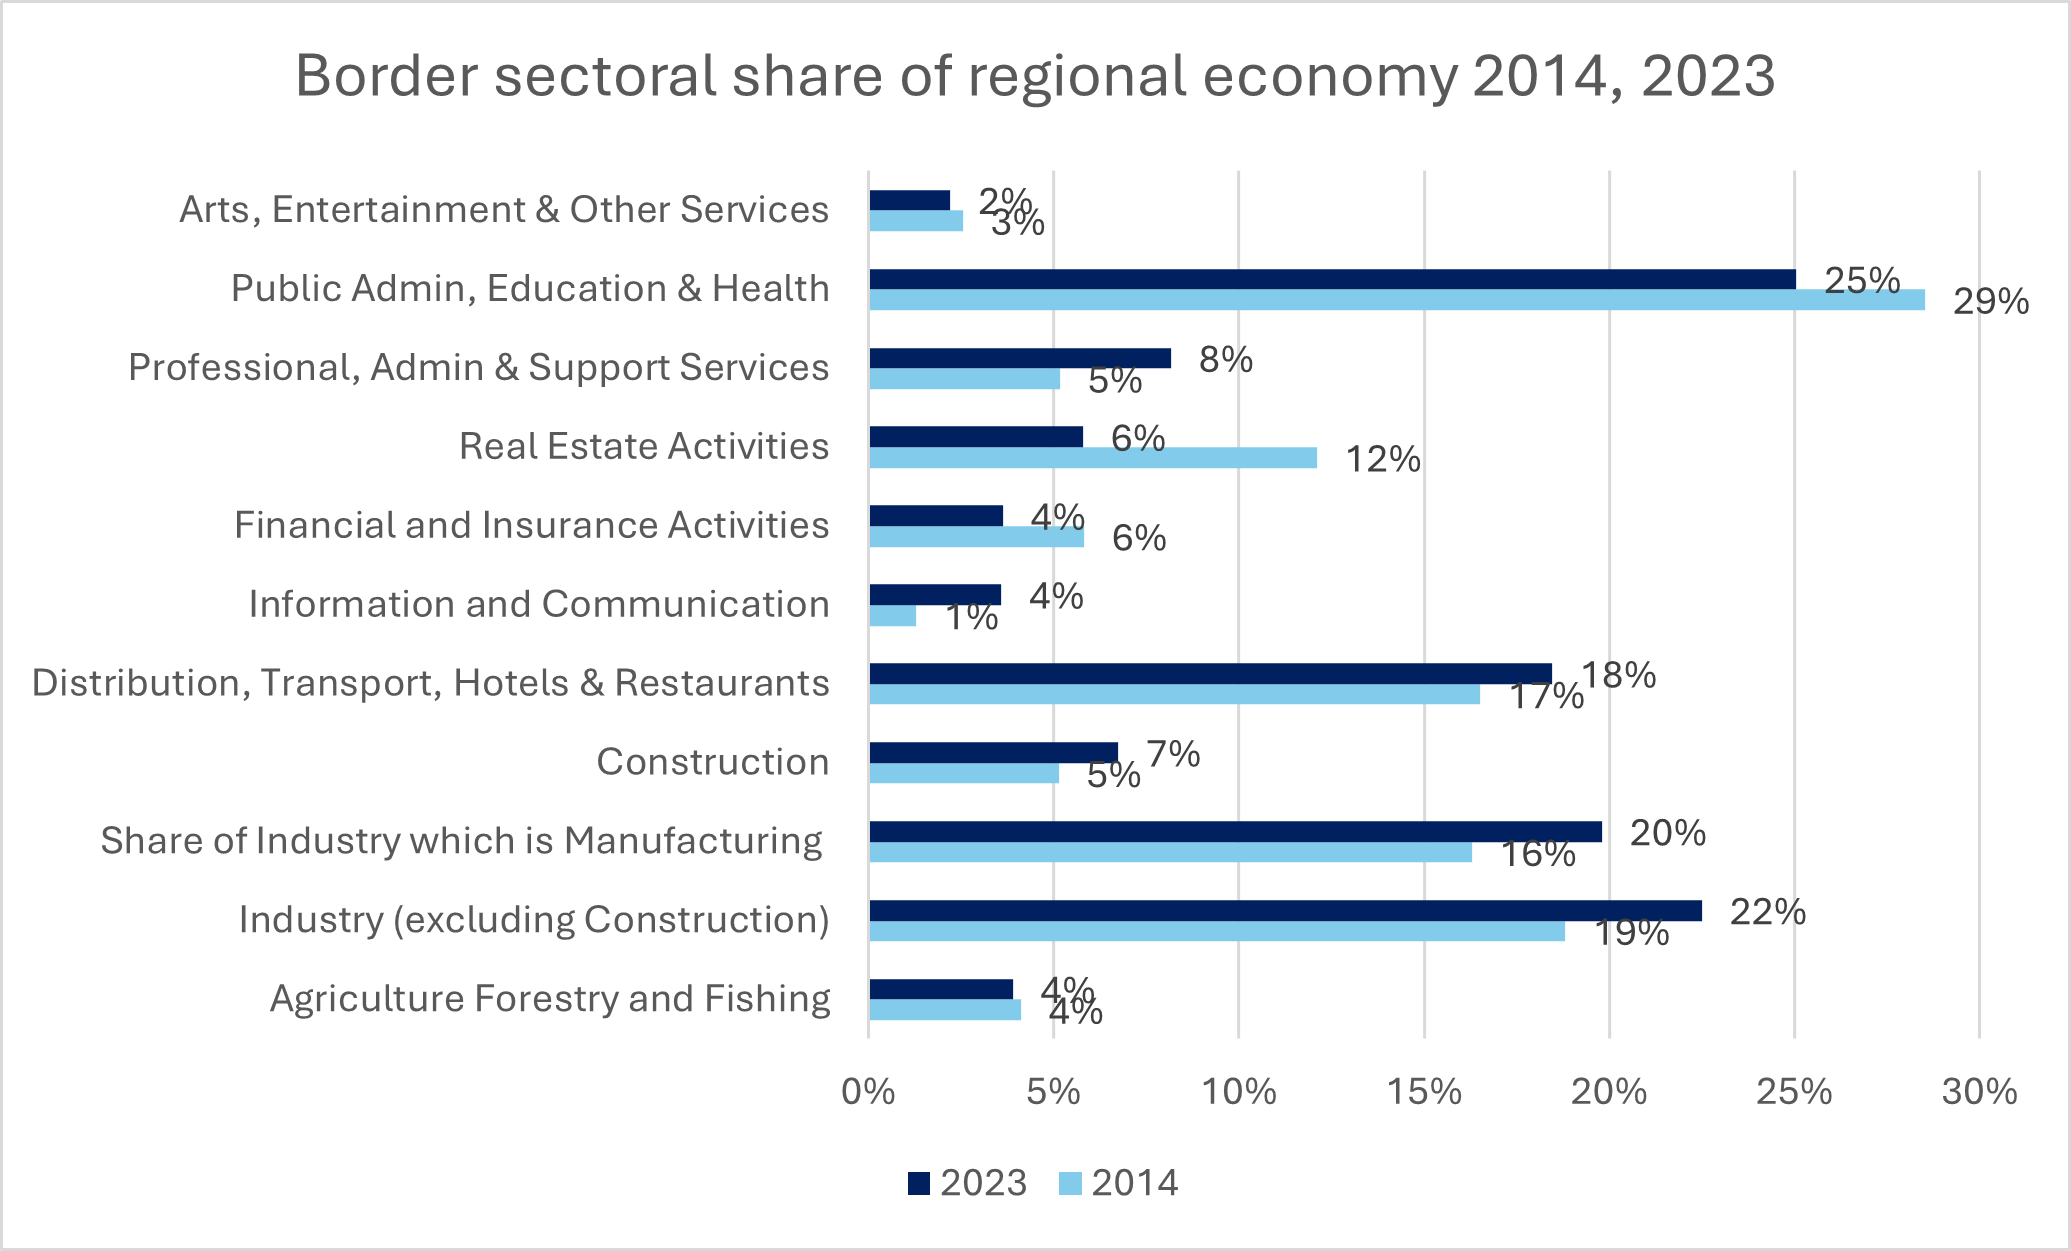
Source: CSO, 2025, County Incomes and Regional GDP 2023 Table 9e Gross Value Added by Sector 2014 and 2023 (own calculations)
There has been some growth in the share from the Industry sector (22% vs 19% in 2014) most of which has come from manufacturing (a 20% share of the economy in 2023 vs 16% in 2014). In the Border region there has also been relatively significant growth in the share from Professional, Administration and Support Services (8% in 2023 vs 5% in 2014) and Information and Communications (4% in 2023 vs 1% in 2014). Again, the value of these sectors is small.
The Mid West region
The Mid West region’s economy grew by 179% between 2014 and 2023. A similar pattern is evident in the Mid West in terms of some sectoral growth (Figure 6), with Professional, Administration and Support Services increasing in share (12% in 2023 vs 10% in 2014) although there is no change in Information and Communications (5% in 2023 and 2014).
Figure 6: Mid West: sectoral share of regional economy 2014, 2023
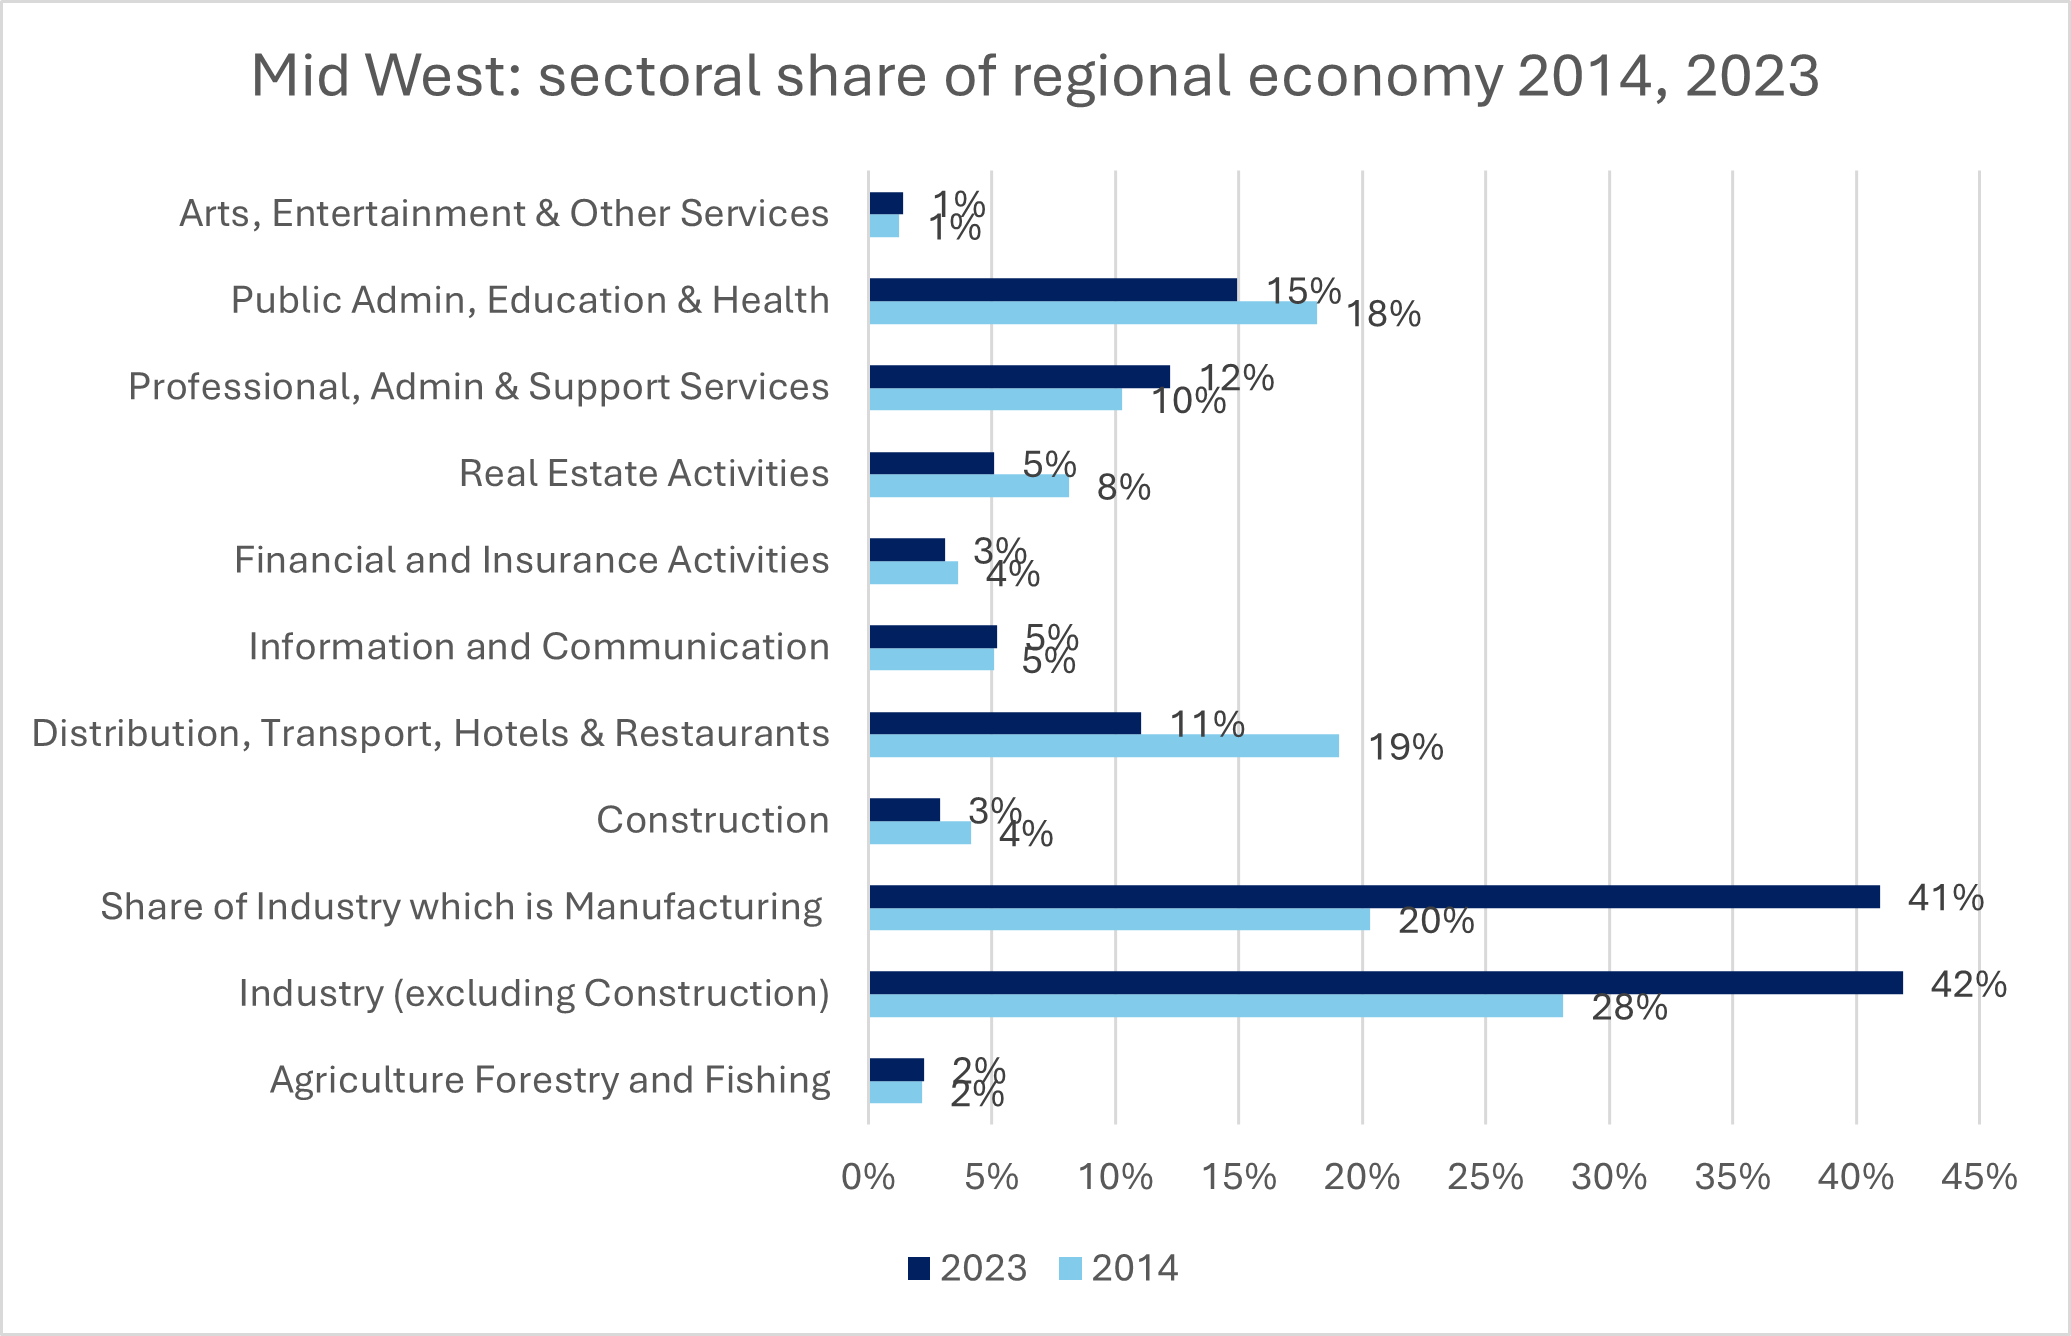
Source: CSO, 2025, County Incomes and Regional GDP 2023 Table 9e Gross Value Added by Sector 2014 and 2023 (own calculations)
However, maintaining and growing the share from these sectors, in the light of very significant growth in the importance of the Industry sector (28% in 2014 to 42% in 2023) is an indication of their underlying strength.
Growth in Industry arises from the Manufacturing subsector which has grown hugely in importance in the regional economy, from 20% of the regional economy in 2014 to 41% in 2023. This is a very significant change, most of the growth in this sector share came following the 2015 level shift in GVA and GDP in the regions and Ireland as a whole (discussed here). Data from 2020 to 2023 shows a slight decline (-6%) in Manufacturing output in the Mid West in this period (it also shows larger declines in the Mid East and South East).
Taking a closer look at key sectors
Having looked at changes in the relevant NUTS 3 regions with a particular focus on Industry (and its Manufacturing subset), and Professional, Administration and Support Services and Information and Communications it is useful to see how these regions compare to the others in relation to change in these sectors between 2014 and 2023.
Figure 7: Percentage growth in Manufacturing GVA for NUTS3 regions and State 2014-2023
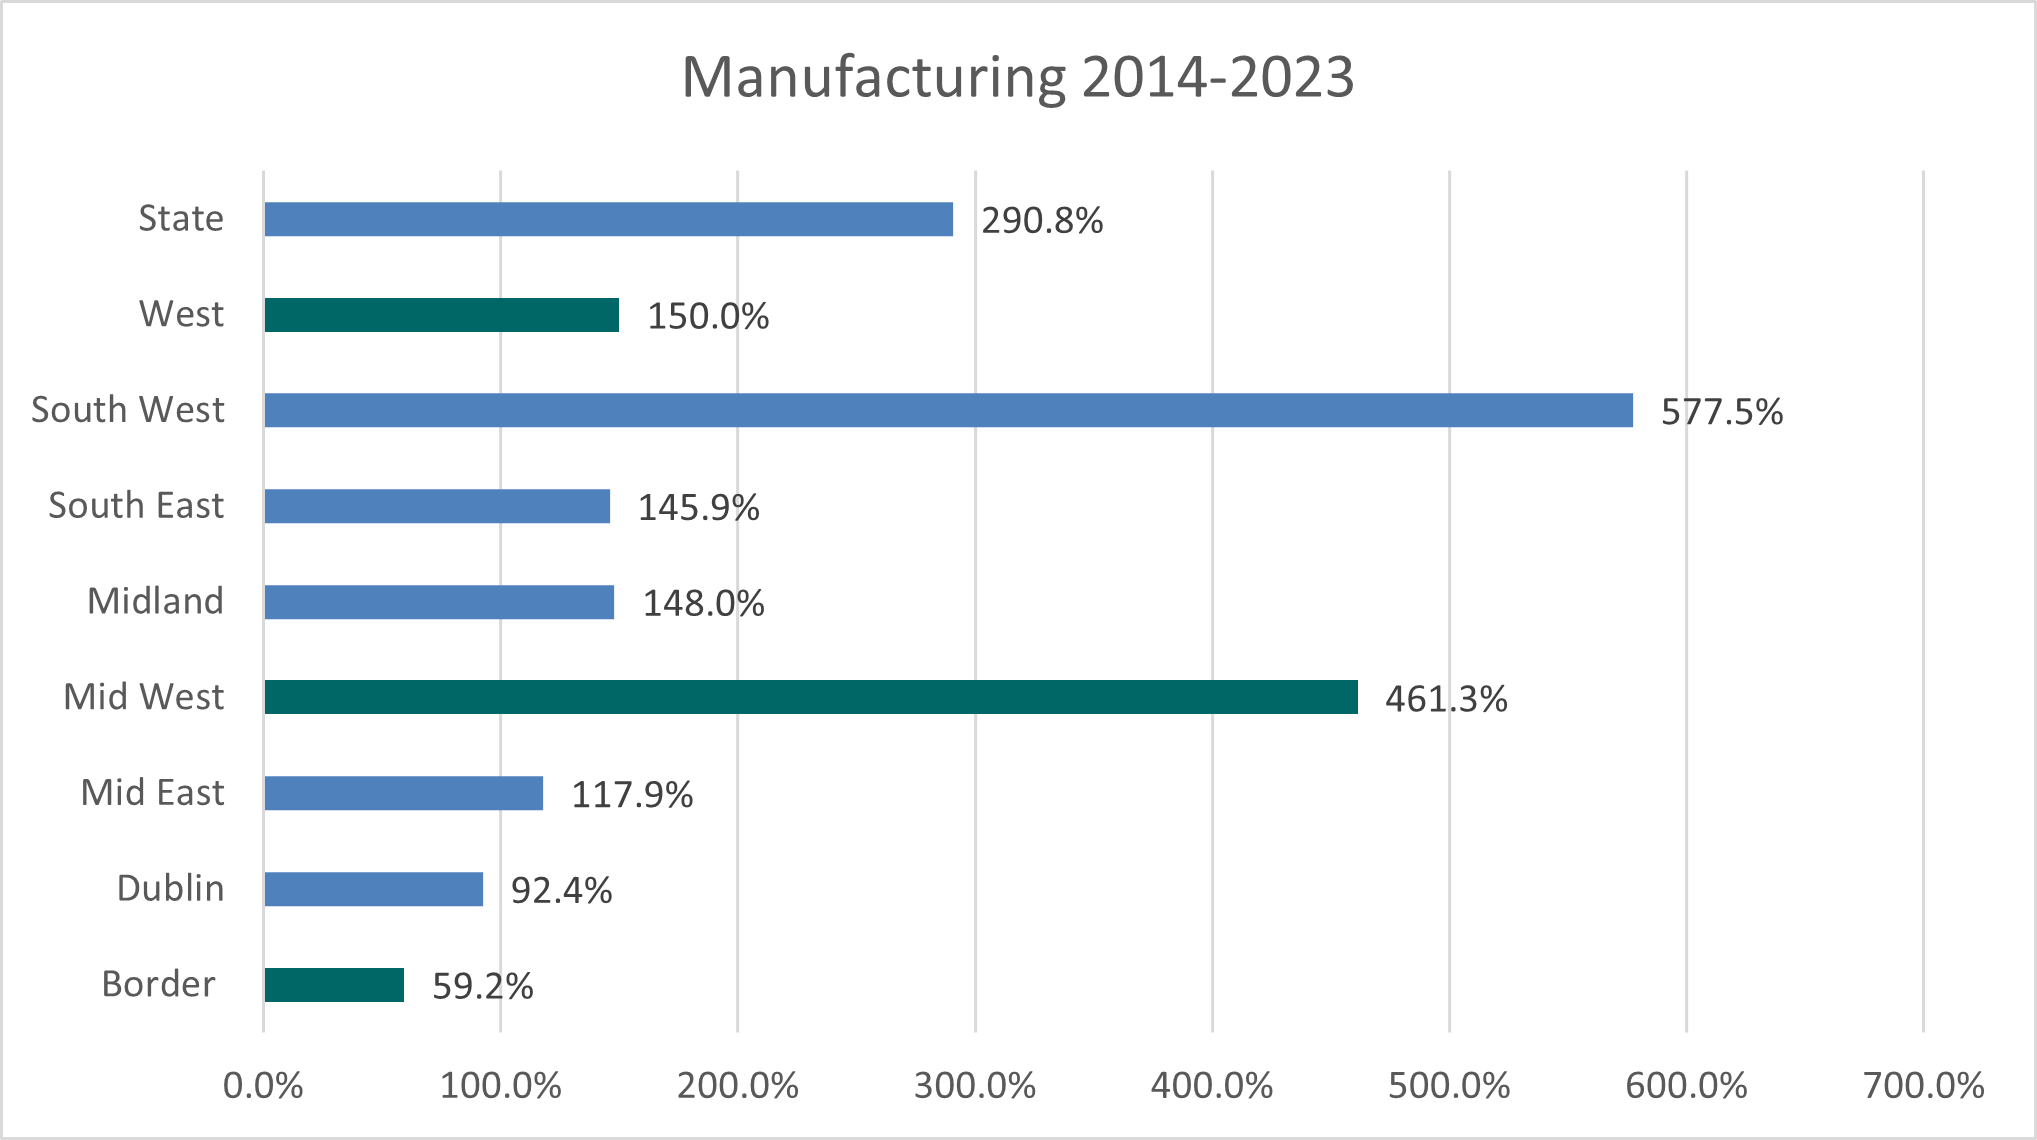
Source: CSO, 2025, County Incomes and Regional GDP 2023 Table 9e Gross Value Added by Sector 2014 and 2023 (own calculations)
Figure 7 shows percentage growth in Manufacturing GVA (i.e. the share of Industry which is Manufacturing) as this has been the driver of growth in the Industry sector. While growth in the South West has clearly been exceptional, reflecting the presence of multinational technology and pharmaceutical businesses, and changes in the methods of accounting for GVA in 2015 (see discussion on GDP limitations above), growth in the Mid West was also exceptional (and experienced similar influences). Similarly, GVA from Manufacturing in the West increased by 150% during that period while the Border showed the lowest growth in GVA from manufacturing in that period.
Figure 8: Percentage growth in Professional, Administration and Support Services GVA for NUTS3 regions and State 2014-2023
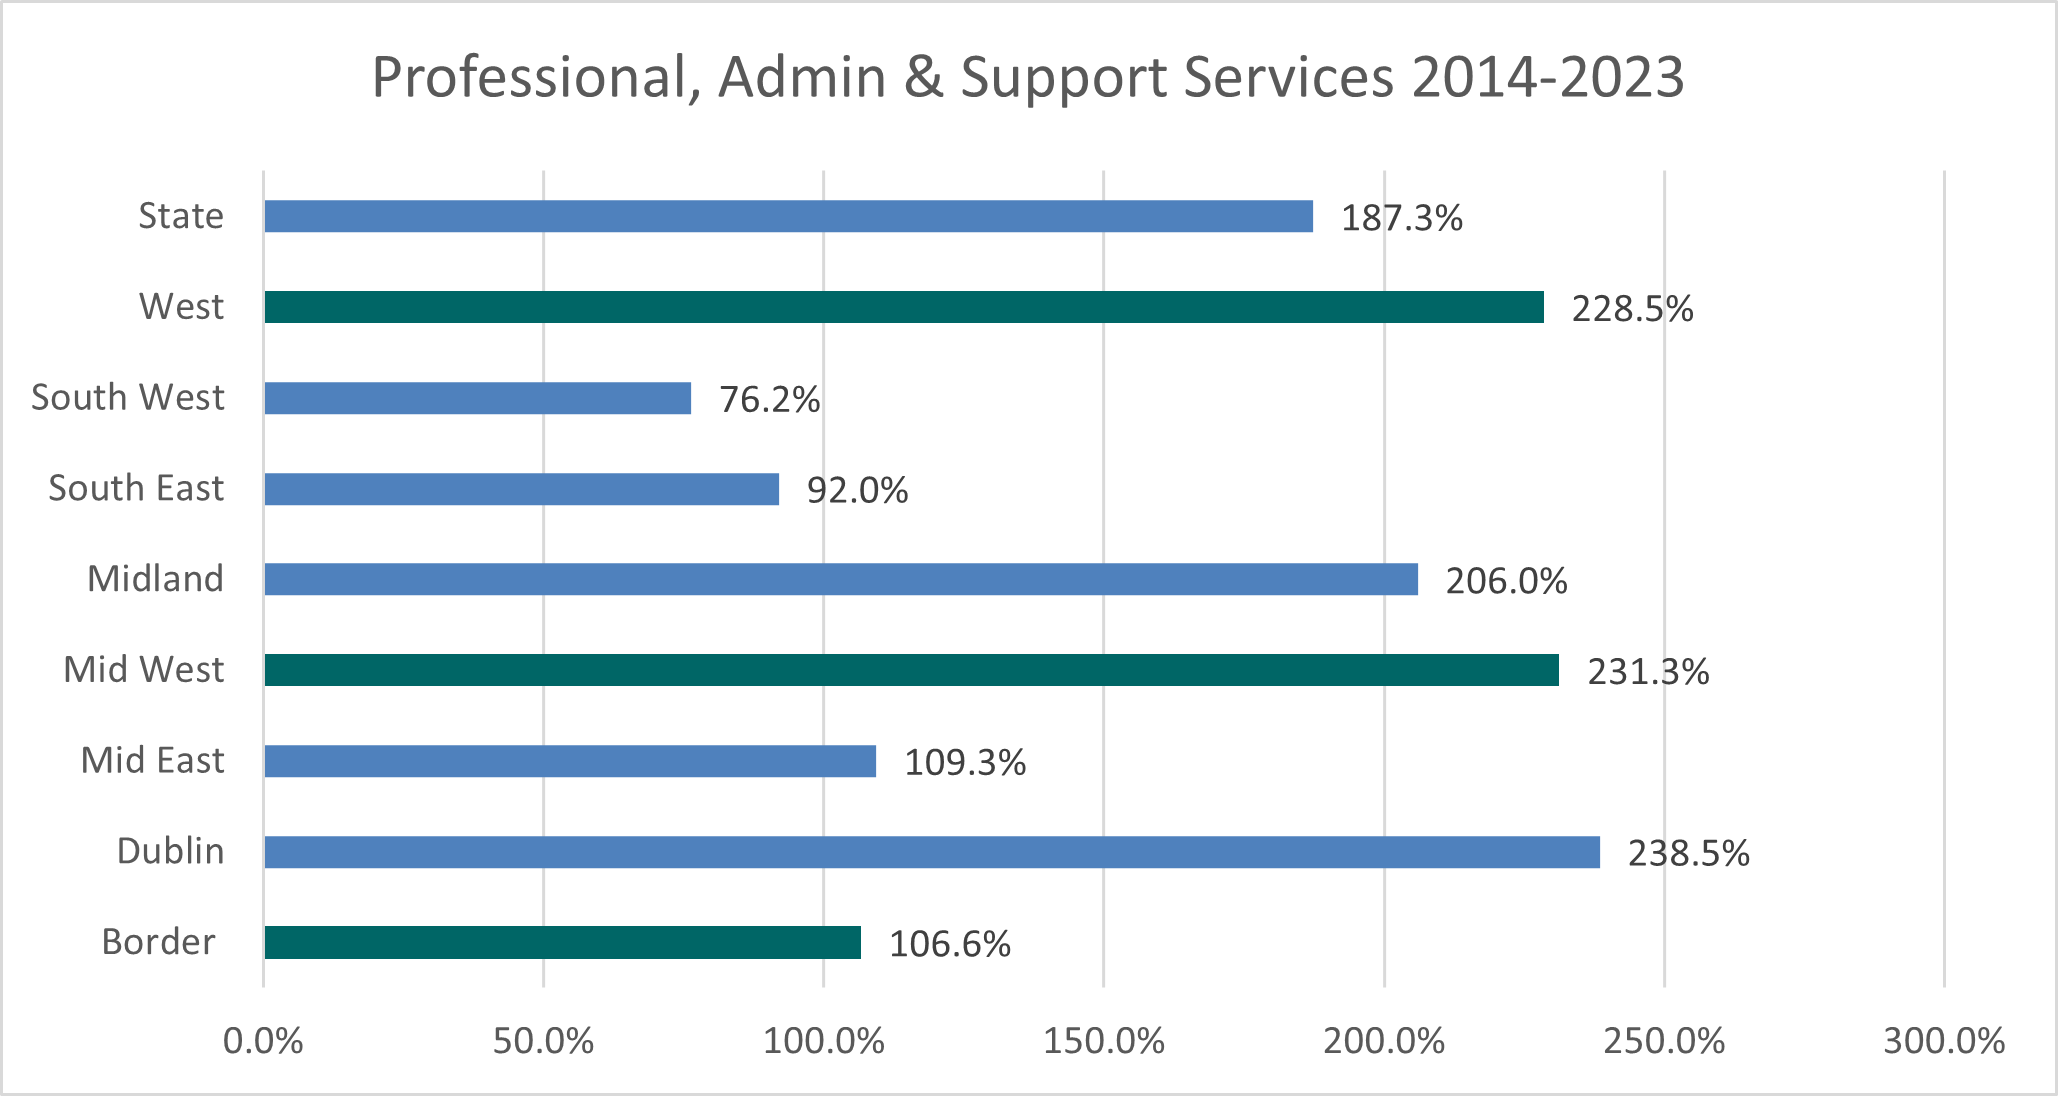
Source: CSO, 2025, County Incomes and Regional GDP 2023 Table 9e Gross Value Added by Sector 2014 and 2023 (own calculations)
When we look at the other high value sector Professional, scientific and technical activities; administrative and support service activities (Figure 8), the three regions which have been the focus of this post all performed well, with the Mid West (231%) and the West (229%) showing the large GVA increases, with the Border region GVA doubling in size although, as discussed, above, the total value of these sectors in these regions is relatively small.
Figure 9: Percentage growth in Information and Communications GVA for NUTS3 regions and State 2014-2023
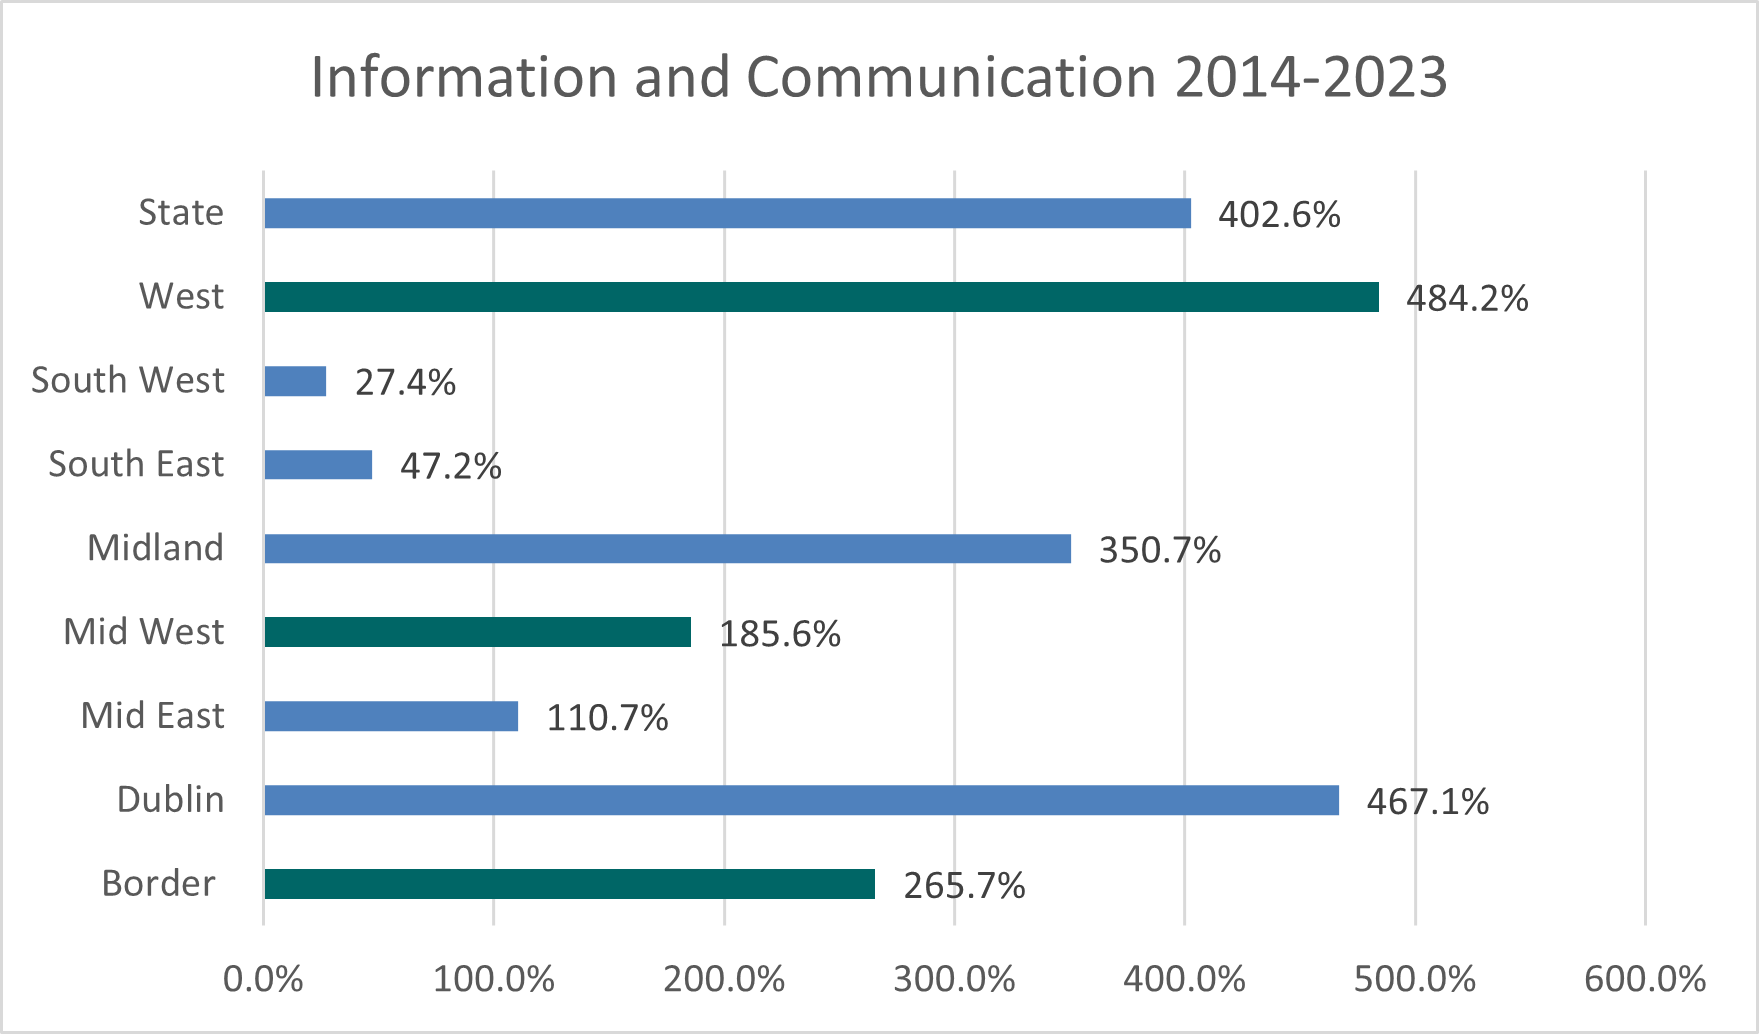
Source: CSO, 2025, County Incomes and Regional GDP 2023 Table 9e Gross Value Added by Sector 2014 and 2023 (own calculations)
There was very significant growth in Information and Communications sectoral GVA in the West region during the 2014-2023 period, from €220m to €1,287m (484%) the largest percentage growth in this sector for a NUTS 3 region. However, the difference in the size of GVA from the sectors is significant. Information and Communications in Dublin in the same period grew by 467% but that growth brought the value of the sector from €15,460m to €87,666m in the ten years under discussion. Growth in sectoral GVA for Information and Communications was also substantial in the Border region (265%) and the Mid West (186%) but again both of these are relatively small sectors as measured by GVA. Nonetheless, as these sectors will be increasingly significant in the future, growth is important both in terms of high value contribution in each region, and also to ensure some regional balance.
Conclusion
The relative importance of different sectors in our regional economies has been changing, with growth in some of the higher value sectors evident in the last ten years. While it is important to be aware of the relatively small size of the regional economies of which the Western Region counties are part, the growth and change continues to be important. As high value sectors grow throughout Ireland, faster growth in some regions affects the regional balance in the economy in terms of contribution of these economies to national GVA. In addition, because the high value sectors which were discussed here tend to have higher rates of pay which in turn will, in the long term, have a significant effect on income (or more precisely, compensation of employees) in the regions, with consequence effect on regional household income.
The focus here has been on regional GVA figures, and despite issues with GDP and GVA measures, they are important regional statistics and important indicators of regional economic activity and essential to our understanding of the changes taking place in Irish regions. Consideration of relative sectoral contributions levels and changes over time can help us better understand economic development and growth in our regions.
As Flaherty, O’Boyle and Myles note in a recent paper, the Irish economy is highly concentrated on a GVA basis but is not so on the basis of employment and sectors’ input-output interdependencies. Over half of Irish GVA is located in two out of Ireland’s 20 economic sectors (NACE A21 aggregation); Manufacturing and ICT, both have the highest shares in the EU. Concentration in Administration & support services is also among the highest in the EU. The authors, examining the same sectors using employment, show the economy to be very dispersed, reflecting Ireland’s relatively high but evenly spread employment levels in services sectors. It will be interesting, in future, to examine how these differences operate at a regional level.
Clearly, in order to understand regional growth and change it is important to use GVA in combination with other data such as that for employment and income. With excellent income figures are now available at a detailed level forthcoming blog posts will consider income data at Western Region and county level, while sectoral employment data provided at regional and county level by the census will also be examined. By looking at this data in more detail, we hope to arrive at a clearer picture of Western Region economy trends and challenges.
Helen McHenry
[1] GDP is Gross Domestic Product, GDP and GVA are the same concept i.e. they measure the value of the goods and services (or part thereof) which are produced within a region or country. GDP is valued at market prices and hence includes taxes charged and excludes the value of subsidies provided. GVA at basic prices on the other hand excludes product taxes and includes product subsidies. See background notes
[2] The Western Region is the term used for the seven counties under the aegis of the WDC (Clare, Donegal, Galway, Leitrim, Mayo, Roscommon and Sligo)