
The Policy Analysis Team at the Western Development Commission (WDC) has compiled a set of timely economic indicators for the Western Region (WR) and Atlantic Economic Corridor (AEC).
The sixth report in the series has been published today.
In this Insights blog post, I provide a commentary on the report.
As the economy begins to re-open there are encouraging signs of recovery.
The recent national macroeconomic accounts show that the Irish economy has performed robustly during 2021. Furthermore, the ESRI has estimated that unemployment will fall to 9% by the end of the year and that modified total domestic demand, probably the most accurate measure of underlying economic activity in Ireland, is set to grow by over 7%. Importantly, the ESRI estimate strong growth continuing into 2022.
Over the medium term, the ESRI note that challenges in relation to meeting climate change, housing and the health sector will require prudent management of the public finances to ensure a sustainable public finance path while addressing these key policy areas. Prudent fiscal management is important as inflationary pressures are already evident and basic macroeconomic theory warns us that further inflationary pressures could come through an “overheating” economy where a rapid domestic recovery occurs on top of large increases in government expenditure. Some of the observed inflation during 2021 is transitory and relates to price behaviour a year ago (so-called “base-effect inflation”) other pressures have come from supply chain disruptions and global factors (e.g. energy prices).
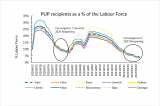
The continued vaccine roll-out and relaxation of public health measures is vital for regional economic development. Previous WDC analysis has stressed the issue of regional variation in terms of COVID impacts. The Western Region and AEC are highly exposed to the COVID-19 shock as a result of the structures of employment and enterprise. Regional and within region variation, in terms of labour market impacts, have been clearest during the most stringent periods of restrictions. When restrictions have been relaxed, this variation has tended to subside rather quickly. This is most evident in the PUP trends. Figure 1 highlights two strong periods of convergence in the labour force share of PUP payments. Those two periods are 1) the summer reopening phases of 2020 and 2) the 2021 re-opening phases.
Figure 1: PUP as a % of the Labour Force: Two Convergence phases.
In the short term, fiscal policy should continue to aim at temporary and targeted support to aid incomes and businesses in affected sectors, to improve healthcare capacity and test and trace systems. For the longer term, the WDC has made recent submissions to the Government across several areas that ultimately provide the framework for regional development policy. These submissions, on the review of the National Development Plan (NDP), the related establishment of the National Investment Framework for Transport and the development of a National Smart Specialisation Strategy, identify key challenges and highlight the ongoing work of the WDC to address these challenges. The WDC Policy Analysis team has recently surmised the regional challenges and opportunities in the face of COVID-19 and Brexit within a policy briefing.
Labour Market
The combined share of the Western Region’s (AEC) labour force receiving the PUP, wage subsidy or on the live register fell to 27.9% (28.5) at the start of August down from 40% a year ago and 50% in May 2020. However, regional and within region variation remains. For example, the share of the labour force in those categories combined, within the AEC counties, ranged from 22% in Roscommon (the lowest rate in the country) to 34% in Kerry (the highest in rate in the country). The regional and within region variation in the labour market has been documented by Lydon and McGrath (2020) and McGrath (2021) as a key feature of the pandemic. Those studies suggest that the variation is related to, and has in some cases exacerbated, pre-pandemic regional structures of economic activity and employment.
Persons receiving the PUP are at the lowest levels since the onset of the pandemic. During mid-October, 14,467 persons in the Western Region received the PUP (3.7% of the labour force). PUP claims in the Western Region have consistently declined from February where the number was 82,414 (20% of the labour force).
The share of the labour force receiving the wage subsidy in the Western Region has typically been lower than the national average. Flows off of the PUP and onto the wage subsidy have resulted in the Western Region and AEC share exceeding the national average since mid-July. This is encouraging given the wage subsidy is tied to employment, unlike the PUP. The national data on sectoral breakdown suggests this is driven by the accommodation and food sector.
Consumption
Sharp Growth in Q3 saw 2021 new cars sales above pre-pandemic levels in the Western Region & AEC. Compared with Jan-Sept 2019, registrations were 1-2% higher in the WR & AEC. Nationally, registrations remained 12% below 2019 levels.
Housing and Construction
The sales and rental price trends reveal similar patterns to suggest the pandemic has coincided with an initial movement away from larger urban areas, particularly Dublin. Whether this reflects a longer-term trend should become clearer as the remaining restrictions are lifted and new working patterns become established.
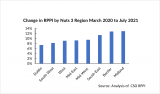
Median sales prices, based on the CSO market transaction data, show a rise in sales prices in all AEC counties when comparing Jan-Aug 2021 with 2019. This data is limited as it does not account for size etc. The official source for house price changes is the Residential Property Price Index (RPPI). The RPPI is unavailable at the county level but is available at the Nuts 3 regional level. The RPPI shows Dublin prices have increased more slowly than the rest of the country during the pandemic (Figure 2). From March 2020 to July 2021 Dublin prices have risen 7% compared with 9% for the West (Galway, Mayo & Roscommon) and Mid-West (Clare, Limerick and Tipperary) regions and 13% in the Border (Donegal, Leitrim, Sligo, Cavan & Monaghan).
Figure 2 RPPI Index Changes from March 2020 to July 2021 by Nuts 3 Region.
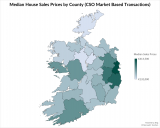
It is worth noting that although there has been growth in house prices in more rural areas these areas still remain comparatively less expensive than in Dublin as suggested by Figure 3.
Figure 3 Median Sales Price by County avg. Jan-July 2021 (CSO market-based transactions – filings).
Similar trends are recorded for 2021 in the Daft.ie Q3 House Price Report where, year-on-year, list prices have risen faster outside of Dublin and the other cities (Lyons, 2021). Lyons notes that Q3 2021 has coincided with a slower pace of list price inflation (although price increases remained substantial) and attributes the slowdown to the easing of public health restrictions and the partial recovery of the second-hand sales market in particular.
Lyons shows that the supply of second-hand housing for sale has held up better in Dublin and the Greater Dublin Area (GDA) than elsewhere in the country. The number of listings in the GDA, over a 12 month period, reached 30,000 in late 2019 before collapsing to below 20,000 during the pandemic. In 2021 there has been an uptick in listings to 24,000 in the 12 months to August 2021 but this is still well below the pre-pandemic baseline.
In the rest of the State, listings reached 40,000 pre-pandemic, collapsed to below 20,000 during the pandemic and have recovered more slowly to just below 25,000 during 2021. Dublin listings on Daft.ie were 17% above their 2015 levels while the rest of the State is 10% below its 2015 level. Lyons attributes the slower price increases in Dublin to greater levels of supply.
The story of the housing market in 2021 seems clear, housing demand has held up well and continues to outpace supply thus prices have continued to rise. The supply of available houses for sale has risen during 2021 but from an extremely low base and remains below pre-pandemic levels that were already failing to meet demand (anyone who has taken an introductory microeconomics course should recall excess demand = a shortage and what happens to prices in a shortage!).
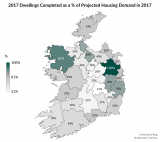
We can gain insight into the extent of the housing shortage by examining dwelling completions compared with estimated housing demand. Housing demand was projected by Bergin and García-Rodríguez (2020) for each county from 2017 up to 2040. If we focus on 2017, we see that nationally, 14,346 dwellings were completed compared with an estimated demand of 27,721, thus about 52% of demand was met. In the Western Region, 1,816 dwellings were completed compared with an estimated demand of 3,568, thus about 51% of demand was met. Figure 4 maps dwellings completed as a share of estimated demand for each county. In the AEC the share ranged from 33% in Sligo to 82% in Mayo. Lyons (2020) estimates a larger national housing demand (50,000 per year) than Bergin and García-Rodríguez.
Figure 4 Dwellings Completed as a % of Estimated Housing Demand.
In the rental market a similar pattern emerges, rents rose annually in all AEC counties during Q2 2021 ranging from 8% in Donegal to 17.3% in Leitrim. The top two largest annual increases in the country were in Leitrim (17.3%) and Clare (16.1%). The national annual increase in rents was 7% driven by Dublin (4.4%) where the lowest increase in rents occurred.
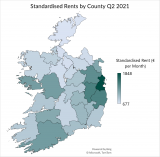
Again it is worth noting that although rents have increased faster outside of the larger urban centres these more rural areas remain to be comparatively cheaper as suggested in Figure 5.
Figure 5 Standardised Rents by County Q2 2021.
To address housing shortages and to match the vision of the population growth targeted under the National Planning Framework it is clear that housing supply will need to increase across the country over the coming decades. Lyons (2016) provides a detailed outline of the issues and policy options to address key issues in the Irish housing market. Several key issues raised by Lyons are being targeted in the Government’s “Housing for All” strategy such as commitments to tackle the costs of construction, building the institutional capacity through a streamlined planning process, and perhaps most notably the switch from a vacant site levy to a zoned land value tax announced in Budget 2022. The devil will be in the detail and the implementation of these policies but there is a clear government target of 33,000 new houses per year from 2021-30 and a commitment to support local authority housing delivery.
While much of the policy focus has surrounded the supply of new housing there is also a considerable shortage of second-hand properties available for sale and a shortage of rental properties. It is hoped that as we move closer to a “new normal” that supply in these categories will continue to rise as individuals become more certain about the future but incentives for boosting supply in these areas should also be explored particularly outside of the greater Dublin where listings in these categories have been slower to recover.
The views expressed here are those of the author and do not necessarily represent or reflect the views of the WDC
Luke McGrath
Economist
Policy Analysis Team