
Join our Insights Mailing List
The Western Development Commission (WDC) has compiled a set of timely economic indicators for the Western Region (WR) and Atlantic Economic Corridor (AEC).
The Fourth report in the series has been published today.
In this Insights blog post, I provide a commentary on the report.
As detailed throughout our recent report Regional Economic Impact of COVID-19: 2020 in Economic Statistics (WDC, 2021), COVID-19 has exacerbated pre-pandemic structural issues in the WR and AEC. These issues include the structures of enterprise and concentrated employment in tourism-focused sectors. The regional dynamics of the COVID-19 economic shock are influenced by the pre-pandemic economic structures. Given these structures, it should be unsurprising in hindsight that the Western Region and AEC counties are severely exposed to the COVID-19 shock and associated lockdown measures.
Labour Market
During the initial lockdown phases, last year, counties such as Kerry and Donegal were hit comparatively hard in the labour market. During May 2020, Kerry and Donegal had almost a third of their respective labour forces in receipt of the PUP alone, higher than any other counties and six percentage points above the national average.
The summer reopening phases then coincided with a sharper reduction in PUP claims within those counties initially more heavily impacted. As a result of these sharp declines, much less regional, and within-region variation was observed. Consequently, before the re-introduction of nationwide restrictions in October, PUP numbers in most counties across Ireland accounted for 9-10% of the labour force.
The Level 5 lockdown restrictions from the end of December have coincided with a re-emergence of those initial regional trends. At year-end 2020, PUP claims in the WR (AEC) reached 57,565 (71,581). As a share of the labour force, this was equivalent to 13% for the WR and AEC. During the first week of February, WR (AEC) claims reached 81,706 (117,207) or 21% of the labour force. PUP claims then stabilised and to 74,688 (107,282) or 19% (20%) of the labour force, by the end of March.
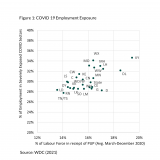
At the end of March, Kerry (25%) had the highest PUP share of the labour force nationally, and Donegal (21%) was 2nd. The within region variation can be explained by COVID-19 employment exposure (WDC, 2021; Lydon & McGrath, 2020).
Figure 1 shows the positive correlation between the average share of the labour force in receipt of PUP during 2020. This positive correlation (Pearson coefficent of 0.65) means that those counties with higher shares of employment in sectors deemed at higher risk to COVID, in general, held higher levels of PUP claims.
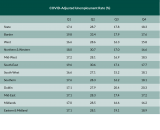
The current levels of “non-employment” give us an indication of future “unemployment”. If the current regional variation in non-employment levels translates into unemployment in the medium term, then it seems reasonable to anticipate similar regional variation in unemployment rates. WDC (2021) constructed regional COVID-adjusted unemployment rates and shows that the Border region (Cavan, Donegal, Leitrim, Monaghan and Sligo) generally held the highest rates during 2020 (Table 1).
As the wage subsidy (EWSS) retains a link between employers and employees, it would be expected that the likelihood of eventual unemployment is greater for PUP recipients than wage subsidy recipients.
As the EWSS replaced TWSS at the end of August, many counties across the AEC were at or above the national average, in terms of labour force share.
Based on data from Revenue, the WR & AEC average was 15% of the labour force in receipt of EWSS in September with a large range from 9% in Roscommon to 19% in Kerry.
Since November, the Western Region and AEC counties have held a lower share of the labour force in receipt of EWSS than the national average. During February, the national average was 14% and the AEC average was ranging from 7% in Leitrim and Roscommon to 14% in Kerry.
The within region variation is again related to the structures of employment and economic activity. The decline in EWSS supports has reflected flows onto the PUP and the live register.
Consumption
Although a limited indicator, new car registrations represent the best timely proxy for consumption that is available at the county level.
Total new car registrations during 2020, compared with 2019, declined by 7-9% in the WR and AEC, less than the national decline of 25%.
During January, a key month for new car sales, registrations fell 17% (18%) year on year in WR (AEC) and equivalent to the national decline.
There was a comparatively lower relative decline in new goods vehicle registrations in the WR and AEC during February (year on year) and an annual increase was recorded during February compared to a decline nationally.
Housing
The initial supply side reaction to the pandemic was to withdraw housing from the market (WDC, 2021).
Consequently, annual sales volumes collapsed by circa 30%, on an annual basis. From Q4 2020, sales volumes have stabilised nationally and across the WR and AEC.
Rents rose annually in all AEC counties during Q4 2020. Leitrim recorded the highest increase nationally of over 11%.
Concerning current and future housing supply, there was an increase in total dwelling completions during 2020 but a decline in both commencement notices and planning permissions in the WR and AEC.
Policy Insights
A lower labour force share of wage subsidy supports coupled with comparatively high shares of PUP claimants present a worry in terms of comparatively high eventual unemployment rates within the WR and AEC, particularly for counties such as Donegal and Kerry. The safe re-opening of the economy as quickly as possible is imperative. In the short term, fiscal policy should continue to aim at temporary and targeted support to aid incomes and businesses in affected sectors, to improve healthcare capacity, test and trace systems and speedy vaccine rollouts.
The views expressed here are those of the author and do not necessarily represent or reflect the views of the WDC
Luke McGrath
Economist
Policy Analysis Team