
In the last post on this topic I examined some of the recent trends in regional GDP. In this post, that analysis is continued, with a focus on the changing share of national Gross Value Added (GVA)[i] coming from each of the NUTS3 regions, regional size and productivity.
As ever, it is important to remember that regional GDP (and associated GVA) is just one measure of regional development and this measure has significant limitations. It does not provide an indication as to the distribution of wealth between different population groups in the same region, nor does it measure the income ultimately available to private households in a region. You can read more about this here. In addition, other issues such as the relocation to Ireland by significant Multi National Enterprises (MNEs) of some or all of their business activities and assets (in particular valuable Intellectual Property) alongside increased contract manufacturing conducted abroad (which is included in Irish accounts), has clearly influenced shares of regional GVA and contributes to the widening disparity. Despite these difficulties, however, it remains one of the most important regional economic statistics and is a key measure of regional development progress and it is useful to consider the contribution of the regional economies to the national total in more detail.
Unfortunately, as noted in the last post, data for both the South West and the Mid West have been suppressed by the CSO for confidentiality reasons (related to the very significant contribution to GVA by a small number of firms). In this post these regions are combined into a region “Mid West & South West” for the purposes of discussion (with their combined statistics inferred from the data). GVA at basic prices is the key statistic discussed here.
Regional Shares of GVA.
The Dublin region (39%) and the Combined Mid West & South West (35%) together account for almost three quarters of the Gross Value Added in the state (see Figure 1) with the Mid East, the next largest region producing 10%. The Border and Midland regions account for the smallest part of national GVA, at 3% each.
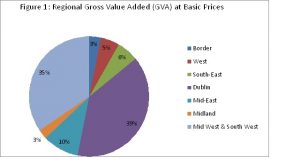
Source: Source: CSO, 2019. Statbank, RAA06 Gross Value Addded by Year, Region and Statistic (2000-2016)
There has of course been very significant growth in GVA in recent years (especially in 2015, as discussed here) and, as much of this occurred in the South West, this has changed the balance of regional GVA with further concentration in the Mid West & South West.
Looking back to 2000 and 2008 the gradual change is evident. In 2000 Dublin the Mid West and the South West together accounted for 68% of national GVA, in 2008 it was 66% and by 2016 it was 74%. This is the consequence of very significant growth in the Mid West &South West economies (240%) between 2000 and 2016. At the same time, GVA in the South East (164%), Dublin (149%) and the Mid East (138%) all more than doubled in size in that period. Growth in the West (85%), Midlands (82%) and Border (69%) was significantly less. The proportion of national GVA produced in these regions consequentially declined, although, as discussed in the previous post on this topic, their output did grow, just at a slower rate.
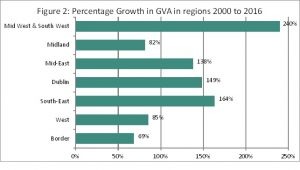
Source: Source: CSO, 2019. Statbank, RAA06 Gross Value Addded by Year, Region and Statistic (2000-2016)
This growth had two phases which can be seen when examining two different periods (2000-2008 and 2008-2016). During the earlier period (2000-2008) GVA, grew in all of the regions, with the percentage growth highest in South East and Mid-East (Figure 3) and lowest in the Mid-West & South West and the West. The Celtic tiger was an opportunity for regions to develop rapidly. Since then (2008-2016) the Mid West & South West and the Dublin region have grown most rapidly.
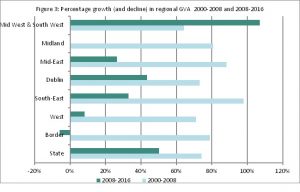
Source: Source: CSO, 2019. Statbank, RAA06 Gross Value Addded by Year, Region and Statistic (2000-2016) –
The recovery from recession has been slower in the smaller regions, between 2008 and 2016 there was a decline in the size of GVA in the Border region, no growth in the Midlands and only an 8% increase in GVA in the West over the 8 year period.
Looking at the share of regional GVA over time (comparing the years 2000, 2008 and 2016) the consequences of the different growth levels is evident. We can see (Figure 4) that between 2000 and 2008 the share of GVA from both Dublin and the Mid West & South West combined had reduced and the share from the South East, Mid-East and Midlands increased slightly. Between 2008 and 2016 the very significant growth in GVA in the Mid West & South West increased the percentage share of the economy in that region to 35% while the share from all other regions consequently declined.
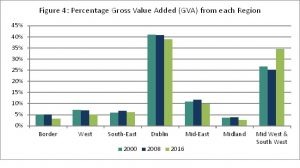
Source: Source: CSO, 2019. Statbank, RAA06 Gross Value Addded by Year, Region and Statistic (2000-2016) –
The West (which is all part of the Western Region) showed a very small decline in its percentage of national GVA (7.1% to 7.0%) while the Border (three of its five counties are in the Western Region) showed a small increase (4.9% to 5.1%) in the period 2000-2008. Their percentage contribution declined further between 2008 and 2016, with the West accounting for 5% of GVA in 2016 and the Border 3%.
Size of Regions and Regional Economies
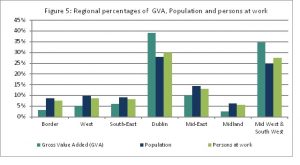
The size of the Dublin and the Mid-West & South-West economies is evident when we focus on regional GVA, but for a more balanced picture it is important to look at how these compare to the regional populations and persons at work. The percentage of the State GVA, Population and Persons at work are shown in Figure 5 below.
Clearly Dublin (39%) and the Mid-West & South-West (35%) account for the highest proportions of GVA, but these regions also have the highest proportion of the population (Dublin 28%; Mid-West & South-West 25%) and the persons at work (Dublin 30%; Mid-West & South-West 27%). Other regions are significantly smaller. The Border region accounts for 3% of GVA, 9% of the population and 8% of the persons at work. The West accounts for 5% of GVA, 10% of the population and 9% of the persons at work.
Source: CSO, 2019. Statbank, RAA06 Gross Value Addded by Year, Region and Statistic (2000-2016) –
There is a clear difference in shares of GVA compared to shares of both population and persons at work (which are quite similar in most region).
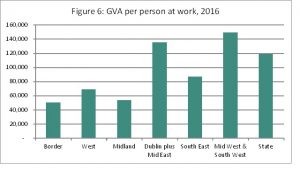
It is therefore useful to look more closely at productivity (GVA per person at work). This is significantly higher in Dublin plus Mid East (these are combined for the purposes of discussion because many of the workers living in the Mid-East are contributing to the GVA of Dublin) and in the Mid West & South West (Figure 6). GVA per person at work is lowest in the Border, West and Midland regions. For the Midland region in particular, the commuting effect may be quite strong, workers living in the Midlands are producing GVA in Dublin but counted as persons at work in the Midlands
Source: CSO, 2019. Statbank, RAA06 Gross Value Addded by Year, Region and Statistic (2000-2016) –
The GVA per person at work in the Border and the West are significant lower than that for the state. As discussed previously, other regions’ GVA has significantly benefited from the relocation to some regions by Multi National Enterprises (MNEs) of some or all of their business activities and assets alongside increased contract manufacturing which all contributed to the very significant growth in GDP and GVA in certain regions (and of course nationally) 2015 (see here for more discussion of this).
Productivity is also influenced by the sectors in each region. Regions with more high value added enterprises (which are generating a larger margin between the final price of the product and the cost of inputs used to produce it[ii]) will tend to have higher GVA per worker. The importance of different sector to regional economies is considered in the next post on this topic.
Helen McHenry
[i] GDP is Gross Domestic Product, GDP and GVA are the same concept i.e. they measure the value of the goods and services (or part thereof) which are produced within a region or country. GDP is valued at market prices and hence includes taxes charged and excludes the value of subsidies provided. GVA at basic prices on the other hand excludes product taxes and includes product subsidies. See background notes .