
Rural people are more reliant on car based transport, they have less available public transport and tend to travel greater distances. Rural dwellers’ transport and travel patterns need to be central to our climate action planning. There must be detailed consideration of transport issues for smaller settlements and rural areas. Following on from the posts relating to a move to a low carbon Western Region on energy efficiency and home heating and retrofits, in this series of blog posts what we know about journeys and transport in rural areas, and the Western Region in particular, is examined, starting with consideration of available data and concluding with a post discussing issues implications of the data.
As discussed previously the Western Region (the area under the WDC remit[1]) is very rural. Using the CSO definition 64.7% in of the population live outside of towns of 1,500 or more[2]. Using the definition in Ireland 2040 the National Planning Framework, 80% of people in Western Region live outside of towns of 10,000. Thus WDC work has a particular focus on the needs of, and opportunities for, more rural and peripheral areas.
One of the key elements of the transition to a low carbon rural region will be emissions reduction from transport in the Western Region. This will require the three pronged policy and personal approach in line with the ‘Avoid, Shift, Improve’ (ASI) framework, a hierarchy that emphasises reducing journeys in the first place, achieving modal shift, and improving mode efficiencies[3].
Addressing transport emissions is a key element of the Climate Action Plan where there is specific focus on the need to address rural issues under the transport heading (e.g. Action 94 to review public and sustainable transport policy and to publish a public consultation on public/sustainable transport policy, including rural transport). This recognises that rural transport needs are different. Under the Plan, Action 100 also addresses the need for a vision for low carbon rural transport and commits to develop a new rural transport strategy and to conduct a comprehensive assessment of rural travel demand, and methodologies for determining it.
Addressing transport and travel in rural regions is complex. In order to understand what needs to be done to reduce emissions from rural travel, we need to know what our travel patterns actually are. These WDC Insights posts will set out, in detail, some of population issues and some of the available baseline information on journeys and transport in rural areas and the Western Region. Knowing the current situation means that we can better understand what we need to do to make the transition possible and ways to make it happen.
In doing this we must recognise that transport is not an end in itself; it is a means for accessing employment, and other services and amenities that contribute to healthy and fulfilling lives[4]. Understanding transport as a social practice is essential to promoting positive behaviour change.
Why are rural areas different?
In the first part of this post I look at some of the reasons that transport in rural areas is different and why reducing emission in rural areas may be difficult, these reasons relate to population, population density, distance to services and to employment and amenities. Understanding patterns of population growth and decline and population density, provide the background for much of the discussion of transport and journeys. It is important to recognise the characteristics of these before considering why we travel.
The Rural Population
Looking at population, some of the issues are immediately brought into focus. In Ireland as a whole, the Census of Population, 2016, just over a third (37%) of the population lived in rural areas (that is outside towns of 1,500). In contrast, in the Western Region showed the opposite pattern and 65% live in rural areas (Figure 1). This is a marginal decline on 2011 (when it was 66%).
The rural population of the seven counties varies from almost 90% in Leitrim (where there is only one urban centre over 1,500) to 54% in Galway which of course includes the largest settlement of Galway City. After Leitrim, Roscommon, Donegal and Mayo are the most rural of the Western Region counties. Sligo and Clare, along with Galway are slightly less rural. It should be noted that Galway county (i.e. excluding the city) is one of the most rural with almost 78% of the population living in rural areas.

Figure 1: Percentage of Population living in rural areas in the Western Region and State.
Source: CSO Census 2016 Profile 2 E2008: Population Percentage in the Aggregate Town Areas and Aggregate Rural Areas Each county, and the Western Region itself (64.7%), has a significantly higher proportion of people living in rural areas than for the State as a whole (37%).
Population Density
Density is another key indicator of rurality and it certainly is important in considering the provision of services. In Ireland as a whole the population density is 70 people per square kilometre and in the more rural Western Region it is just under 32 people per km2 . Again there is considerable variation by county and as can be seen in Figure 2 below, this largely mirrors the rurality of each of the seven counties.
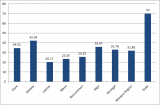
Figure 2: Population Density in the Western Region and State (persons per sq km)
Source: CSO Census 2016 Profile 2 E2013: Population Density and Area Size 2011 to 2016 Galway (county and city) has the highest population density (42 people per square km) and Leitrim has the lowest with just over 20 people per square kilometre.
Population in Towns
The population of towns across is also important, and looking at towns across the Western Region the weak urban structure of the region is evident. Galway is the significant city, with a population of 79,934 in 2016. Only five towns have a population of more than 10,000 people (Ennis, Letterkenny, Sligo, Castlebar and Ballina), and there are a further seven towns with a population of more than 5,000 giving a total of 13 towns including Galway in that size category (5,000+) in the Western Region. Another 27 towns in the Western Region have a population of more than 1,500 and which are therefore categorised as urban. This give a total of 42 ‘urban’ settlements, that is, places with a population of over 1,500 in the 2016 Census of Population.
While these urban populations are significant in the context of the region, it should be remembered that more than half a million people (535,953) are living in rural areas (in small settlements and open countryside) in the Region. The CSO also provides population details of a further 201 settlements in the Region, (the smallest of these is Malin, population 92) and 103,936 people live in these. A total of 440,888 (53%) therefore live in more open countryside (and in even smaller settlements).
Rural Categorisation
The CSO has recently published Urban and Rural Life in Ireland which includes a six way classification of urban and rural areas in, from urban to remote areas and these are shown in Figure 3 below. Most of the Western Region, with the exception of the area around Galway city, falls into the most rural classifications ‘Rural areas with moderate urban influence’ and ‘Highly rural/remote areas’. These areas are likely to be the most difficult to address transport emissions, with few public transport options, longer distances to services and often lower household incomes than some of the other rural categories.
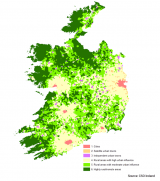
Figure 3: Population distribution by six way urban/rural classification using Census 2016 results
Source: CSO Ireland, 2019. To view the interactive version of the below map, click here. The map can be used to find the urban and rural six-way classification assigned to a particular address (searchable by Eircode or address).
Travel patterns – why we travel
The rural nature of the Western Region has implications for how we reduce transport emissions, but the reasons we travel are also very important, both in terms of options for reducing journey numbers and types, and the distances and nature of the journeys. In this section the reasons for journeys are considered, before we travel to it is now useful to consider why we travel and some of the factors influencing the journeys made in rural areas.
Understanding why we travel and the journeys we make will allow us to better understand how we might influence a change in travel patterns in order to reduce emissions form transport. The CSO’s National Travel Survey (2016) gives a breakdown of the reasons for journeys made (Figure 4). The most significant reason for a journey was for work at almost 30% but shopping (almost 22%) and companion and escort journeys (15%) were also quite significant.

Figure 4: Distribution of journeys by purpose, 2016
Source: CSO Ireland, 2017, National Travel Survey
The importance of these reasons has been quite stable over other years when the survey has been conducted, but the increased importance of work journeys since 2012 and 2013 is clear (see Table 1), and consistent with the growth in the economy and employment between 2013 and 2016. This link between journey numbers and economic growth has proved difficult to address.
Table 1 Percentage distribution of journeys by purpose, 2013, 2014 and 2016
| Purpose | 2013 | 2014 | 2016 |
| Work | 24.8% | 25.0% | 29.3% |
| Education | 4.6% | 4.5% | 4.0% |
| Shopping | 22.7% | 24.0% | 21.9% |
| To eat or drink | 1.9% | 1.8% | 2.4% |
| Visit family / friends | 10.2% | 10.8% | 8.6% |
| Entertainment / leisure / sports | 9.8% | 9.9% | 9.2% |
| Personal business | 6.4% | 5.2% | 5.7% |
| Companion / escort journey | 15.2% | 13.8% | 15.2% |
| Other | 4.2% | 5.1% | 3.8% |
Source: CSO Ireland, 2017, National Travel Survey 2016 Table 1.3 (XLS 11KB)
These reasons for travel are also broken down by the type of area where the journeys are made (See Figure 5). In this the CSO used three categories[5], thinly populated area refers to rural areas; Intermediate density area refers to towns and suburbs; densely populated area refers to cities, urban centres and urban areas. Journeys to ‘visit family and friends’, ‘companion and escort’ journeys and ‘entertainment’ are more important in rural areas than in the other categories. This may reflect the age profile of rural regions, with more older people (and often an higher child population) but with fewer in the working age categories (read more about that here).
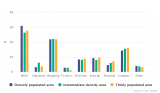
Figure 5: Distribution of journeys by Purpose and Degree of Urbanisation
Source: CSO Ireland, 2017, National Travel Survey
The National Transport Authority conducted a National Household Travel Survey in 2017[6] and reasons for trips are analysed across six different urban and rural categories (National, Rural and ‘Other Urban’ (population between 1,500-10,000)) are shown in Figure 6 below.
Again, travel for work or business is the most important category across all three areas, with travel for education significantly more important in this survey (23% nationally), than in the CSO’s National Travel Survey (4% in 2016). Educaiton related travel was highest in rural areas (24%) again, perhaps relating to the relatively lower numbers in the working age cohort.
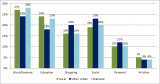
Figure 6: Reasons for Trips, National Household Travel Survey, 2017
Analysis by AIRO for the WDC[7] examined labour catchments for the 42 towns in the Western Region (towns of over 1,500) adding to our understanding of journey patterns and the important of smaller urban areas in employment in the region (read more about it on the blog here or here and download the 2018 report here). This map of local labour catchments (Figure 7) gives a good overview of travel patterns for employment purposes.
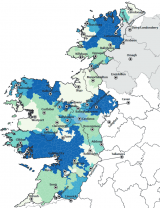
Figure 7: Labour Catchments of 42 Towns in the Western Region, 2016
Source: WDC, 2018, Travel to Work and Labour Catchments in the Western Region: A Profile of Seven Town Labour Catchments
This ties in with the CSO findings, from the recently released Urban and Rural Life in Ireland, that more than three in four workers from rural areas do not work in a City. Of all the workers who lived in ‘Cities’ in 2016, 54.7% worked in Dublin City and suburbs while 28.3% worked in the remainder of the country. For workers living in ‘Satellite urban towns’, 60.9% had their place of work in the remainder of the country while 29.8% worked in Dublin City and suburbs. It also found that most workers who lived in areas other than ‘Cities’ did not work in a city. More than 90% of workers who lived in ‘Independent urban towns’, ‘Rural areas with moderate urban influence’ and ‘Highly rural/remote areas’ worked outside of the five cities while 76.1% of workers from ‘rural areas with high urban influence’ and 60.9% of workers in ‘Satellite urban towns’ did not work in a City.
Working from Home
Interestingly, that same publication (Urban and Rural Life in Ireland) also showed that one in ten workers in ‘Highly rural/remote areas’ work mainly from home (Figure 8).There were 94,955 people aged 15 and over at work in 2016 who worked mainly from home, 4.8% of the total 1,970,728 people at work. The proportion of people working mainly from home was highest at 9.8% in ‘Highly rural/remote areas’, compared to the lowest percentage of 2.3% in ‘Cities’. Twice as many people worked from home in the three rural areas (63,728) than in the three urban area types (31,227). This relates in part to the number of farmers in these areas.
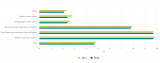
Figure 8: Proportion of persons who were working from home by area type, 2011, 2016
Source: CSO, 2019, Urban and Rural Life in Ireland, 2019 Table 8.2 The chart is also here
The pattern of home working in the Western Region and other patterns of remote and e working have been discussed in more detail on the blog. Increasing the prevalence of working from home, and in alternative work places which require shorter journeys, is likely to be an important part of policy to reduce emissions from transport in rural areas in the future (and will be discussed more in a later blog).
Conclusion
This post, the first in a series on transport statistics for rural areas and the Western Region, examines the issues of population and population density, and well as the reason for travel in rural areas and Western Region counties. The next posts in this series will look at distance to services as a driver of transport demand. The collation and examination of this data will allow us better understand the reasons for and nature of rural journeys, which is in itself essential to design policies to reduce emissions and help us to meet our transport targets as well as developing develop more sustainable rural transport options.
While I will continue this analysis for the WDC as part of our work on rural areas transition to low carbon regions, I hope that the data highlighted in these posts will also be of use to others considering this complex issue.
Helen McHenry
[1] There are seven counties in the Western Region: Donegal, Sligo, Leitrim, Roscommon, Mayo, Galway and Clare.
[2] CSO, Census of Population, 2016
[3] See more discussion in the NESC paper Advancing the Low-Carbon Transition in Irish Transport
[4] See the Climate Challenge paper (no.3) of the public consultation on sustainable mobility policy here
[5] This classification is created from an aggregation of population density estimates derived from the Census of Population.
[6] The Household Travel Survey was also conducted in 2012 and is expected to be carried out every five years.
[7] https://www.wdc.ie/docs/TraveltoWork_LabourCatchments_WesternRegion2016_FullDoc.pdf