With the Irish economy again experiencing a period of significant expansion (it is estimated to have grown by 6.7% in 2018) it is important to consider how different Irish are regions doing in this time of growth. While this was examined for the three Assembly regions (Eastern and Midland, Southern and Northern and Western) in a previous post using Eurostat data, we now have the opportunity to consider economic growth and prosperity, as measured by GDP, for the smaller regions.
Regional GDP data (NUTS3 regions) for 2016, with preliminary figures for 2017 was published in April, so in this post we consider the most recent information, as well as looking back to 2008, and observing the regional patterns of recession and growth in the last decade. While income data is available at county level (discussed for the Western Region in a previous post) the GDP and GVA data[i] is only available at regional level. The Western Region, under the WDC’s remit includes the entire West region and three of the five counties in the newly delineated Border region (Louth is now included with the Mid East as discussed here). Clare is part of the Mid West and unfortunately data for the Mid West has been suppressed in the CSO publication for reasons of confidentiality. In charts for this post the Mid West and South West (also suppressed) have been combined for the years 2015-2017.
When comparing regions of very different sizes GDP per person is the most useful measure (total GDP and regions share of the national economy will be discussed in the next post on this topic). Figure 1 illustrates the very significant differences in GDP among regions. In both 2016 and 2017 the lowest per capita GDP was in the Border region (€21,446 in 2016) followed by the Midland[ii] (€23,417 in 2016) and the West (€29,798 in 2016).
Figure 1: Regional GDP per person 2016 and 2017 (estimated)
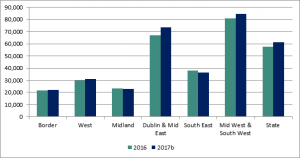
a Data for 2015, 2016 and 2017 suppressed in MW and SW for reasons of confidentiality, b Preliminary
Source: CSO, 2019, County Incomes and Regional GDP, Table 9a, Mid West and South West own calculations based on Table 9 and Table 13, 13a
In contrast, the Mid West & South West had the highest per capita GDP (this is a combined region as data for the two regions was suppressed) at €80,758 in 2016 which is almost four times greater than that in the Border region. There are some unusual factors underlying this growth which are discussed in detail here. Dublin, when considered alone had the highest GDP per person at (€81,184) in 2016 (though not in 2017) but it is shown here with the Mid East as much of the Dublin GDP is produced by workers living the Mid East (discussed here) and so considering the two region’s GDP together, when examining the per capita data gives a more realistic picture. The very high levels of GDP per person in these regions (with large populations and significant economic output) bring GDP person in the State was €57,650 in 2016.
While 2017 figures are preliminary it is nonetheless interesting to look more closely at the growth rates most recent two years for which data is available. According to this measure (GDP at current market prices) the economy of the state grew by 4.1% between 2015 and 2016, and 7.6% between 2016 and 2017. Interestingly, the South East showed the highest annual growth (17.7%) between 2015 and 2016 with the Mid East next highest (12.8%) followed by Dublin at 9.7%. The economy of the Border region grew by 6% but regional GDP decreased in the West by 6.1% between 2015 and 2016 and by 3.7% in the Midland region. Surprisingly, as the South West was one of the regions with the most significant growth in 2015 the Mid West & South West economy contracted in that year by 3.6%. The economy in all regions grew in 2017 (except the Midland which contracted by 0.7% in the year and by 4.3% in total since 2015) with the biggest growth in Dublin (12.6%). The West also showed a year on year recovery (5.3%) but still is estimated to have a smaller economy in 2017 than 2015 (by 1.1%).
Figure 2: Percentage change in Regional GDP between 2015 and 2017
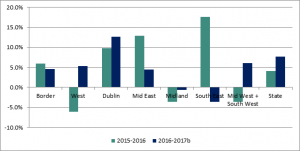
b preliminary figure; MW & SW, own calculations
Source: CSO, 2019, Table 9 GVA per Region at Current Market Prices (GDP), 2008 to 2017
Looking back over a longer period, the very significant differences in patterns of growth are evident (Figure 3). Dublin, which was always the largest economy, has grown more rapidly than other regions since 2012, while the Mid West & South West combined show the impact of the very significant level shift in GDP which occurred in 2015 (and is discussed in more detail in this post Leprechauns in Invisible Regions: Regional GVA (GDP) in 2015)
Figure 3: GDP per person in NUTS 3 regions 2008-2017
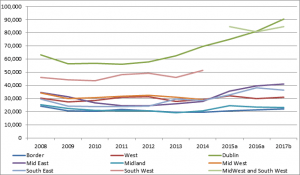
a Data for 2015, 2016 and 2017 suppressed for reasons of confidentiality, b Preliminary
Source: CSO, 2019, County Incomes and Regional GDP, Table 9a, Mid West and South West own calculations based on Table 9 and Tables 12,13, 13a
Other Regions had more modest growth, but both the South East and the Mid East have recovered well since the recession. This is shown more clearly in Figure 4. The economy of the Border region is estimated to be 0.8% smaller in 2017 than 2018 and the Midland region is 0.4% smaller. The economy of the West region grew modestly (10.6%) during the ten year period. These regions clearly have not benefited from the recovery and growth in economic activity experienced in other regions. The economies of the Mid West and South West combined have more than doubled in size (118% growth) between 2008 and 2017, while the Dublin economy grew by more than 50%.
Figure 4: Growth and decline in regional economies GDP since 2008.
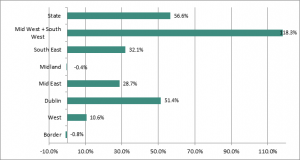
Source: CSO, 2019, CSO, 2019, County Incomes and Regional GDP, Table 9 GVA per region at current market prices (GDP) 2008-2017, own calculations
Given the very different growth rates in the regional economies, there has been significant divergence among regions since 2008 and in particular since 2012. The divergence is shown clearly over time when looking at how each of the region compares to the State average. This is done using an Index with the State in each year equal to 100 (Figure 5). In 2008 only two regions (Dublin and the South West) were above the state average, and the difference between the highest (Dublin) and the lowest (Border) was 85 points. By 2017 Dublin and the combined region (Mid West and South West) were above the state average, and the other regions remained below, with the difference between the highest (again Dublin) and the lowest, (the Border) now 111 points. By 2017 the Border, (36.1%) and the Midland region (37.5%), were significantly lower than the state average, while GDP per person in the Dublin region is 47% more than the state average. The West, which has the strong economic driver of Galway, had a GDP per person of 72.5% of the state average in 2008 and 50.6% by 2017.
Figure 5: Index of GVA per person (Basic Prices) for each region 2008-2017, State=100
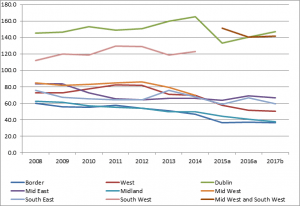
Source: CSO, 2019, County Incomes and Regional GDP, Table 10, MW & SW own calculations.
Along with this divergence in economic activity among regions within the State, it is interesting to look at the pattern in relation to the EU28. Figure 6 shows GVA in the State relative to the EU28 increased from 129% of the EU28 average in 2008 to 178% in 2017. The Dublin region grew even more strongly (from 188.7 in 2008 to 262.3 in 2017). The West, which was 95.7% of the EU28 average in 2008, peaked in 2012 at 107% of the EU28 average, but has since fallen back to 90%.
Figure 6: Index of GVA per person (Basic Prices) for each region and state 2008-2017, EU28=100
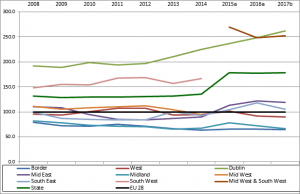
Source: CSO, 2019, County Incomes and Regional GDP, Table 11, MW & SW own calculations.
Similarly the Border region which was 79% of the EU average in 2008 had decreased to 64.3% in 2017. Clearly these regions are not just falling behind in relation to the state average, they are also diverging from the EU average, which is a cause for concern. As discussed in this post A Tale of Three Regions: GDP in the new NUTS2 Regions it also has implications for the status of the regions in relation to cohesion funding and the Border Midland and West NUTS2 region will revert to Transition Region status from 2021.
Conclusion
GDP is the key measure of a how region’s economy is doing and is one of the important indicators of regional wellbeing[iii]. But the data shows that divergence in regional GDP is increasing, with some regions are experiencing very rapid economic growth while others, especially those in the Western Region (the Border region and the West) along with the Midland region are experiencing more modest growth and even contraction.
Given the significant growth of the national economy this is an important time to address issues in lagging regions such as the infrastructure deficits and other structural economic issues and to incentivise regional employment growth and make it easier for new businesses to establish and existing enterprise to survive.
Regions are the drivers of modern economic systems and all regions have the potential to thrive and to contribute to the national economy. However, because success breeds success some regions do this more effectively than others. Less advantaged regions will benefit if policy is focused on ensuring that they too can reach their potential. With the economic upturn, regional policy must be prioritised, it is a waste of talent and opportunity not to realise all regions’ potential. It is to be hoped that the Ireland 2040 project can achieve this.
Helen McHenry
[i] GDP is Gross Domestic Product, GDP and GVA are the same concept i.e. they measure the value of the goods and services (or part thereof) which are produced within a region or country. GDP is valued at market prices and hence includes taxes charged and excludes the value of subsidies provided. GVA at basic prices on the other hand excludes product taxes and includes product subsidies. See background notes
[ii] Although the Midland Region has consistently one of the lowest GVA per person, and Dublin and the Mid East the highest, the fact that GVA is measured where it is produced and the population is counted where people reside, means that those commuting from the Midland region of Dublin and the Mid East are contributing to the GVA of that region (which is why for GDP per person Dublin and the Mid East are often shown as combined for per capita data), while they form part of the denominator in the Midland region, so increasing the GVA of one and reducing that in the other.
[iii] Discussions of GDP inevitably must also consider on the limitations of the statistic as a measure of economic development (see here ) but it is the key statistic used, despite shortcomings. As Eurostat notes here GDP per capita does not provide an indication as to the distribution of wealth between different population groups in the same region, nor does it measure the income ultimately available to private households in a region