

The CSO released data on County Incomes and Regional GDP for 2017 last month (along with preliminary figures for 2018). In this post changes in disposable incomes per person in Western Region counties incomes in the Western Region are examined with a particular focus on the differences among counties and the changes over time. Regional GDP will be considered in a forthcoming post.
It should be remembered that the ‘Household Disposable Income per person’ discussed in this post is calculated at a macro level and the county data is most useful for comparison among counties and over time. Indeed the CSO notes that “While the county figures involve uncertainty, they do provide a useful indication of the degree of variability at county level.”
The map from the CSO below gives a quick overview of Household Disposable Income per person in 2017. It shows, unsurprisingly, that the highest disposable incomes are in the east and south, while counties in the west and north have the lowest disposable incomes. The highest disposable income per person is in Dublin which, along with Kildare, Limerick, Wicklow and Meath, had per capita disposable income greater than the state average in 2017 while Cork, Tipperary, and Westmeath were just below (see Figure 1 below for more detail).
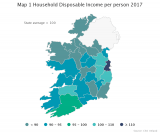
Source: CSO, 2019, County Incomes and Regional GDP 2017
A summary of key data for Western Region counties is provided in Table 1 below. The data for 2017 can be regarded as more robust than the 2018 estimates and so it is used for most of the comparisons in this post. In 2017, disposable income per person in the Western Region was €17,856 in 2017 and in 2018 it is estimated to have increased to €18,007 (the Western Region figures were calculated using inferred populations).
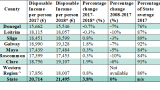
Table 1: Disposable income data for Western Region counties
*CSO Preliminary Estimate for 2018. ^Own calculations
Source: CSO, 2020, County Incomes and Regional GDP 2017 and CSO Statbank Table CIA02
Disposable income per person in Donegal has been consistently the lowest in the region (and nationally) and estimates for 2018 show a small decline in incomes in Donegal (-0.7%) and Leitrim (0.3%) between the two years. Disposable Incomes in Donegal in 2017 were only 76% of the state average. Only two Western Region counties (Galway and Clare) had disposable incomes of more than 90% of the state average, while Sligo had a disposable income of 89% of the state average. Incomes were 84% of the state average in Mayo and Roscommon. The Western Region as a whole had a disposable income per person of 86% of the state average in 2017.
The most significant growth between 2017 and the 2018 estimate was in Clare (1.9%) with income in Galway growing by 1.8%. For the Western Region as a whole, per capita disposable incomes showed a growth of 0.8%. Disposable income per person in the state was €20,714 in 2017 and is estimated to have grown by 3.8% to €21,495 in 2018. As noted, however, the 2018 data is estimated[1]. Household Disposable Income per Person in Dublin is estimated to have grown by 6.8% and by 8% in Laois, 7% in Westmeath, 6% in Offaly and 5.3% in Kildare. It is estimated to have fallen in Wexford, Leitrim, Cavan, Monaghan and Donegal. The differing growth rates among counties are giving rise to increasing regional imbalance.
Disposable income per person for all Irish counties is shown in Figure 1 below. As mentioned, disposable income per person in Donegal lowest in the state while Roscommon and Mayo have the next lowest. In contrast, Galway had the twelfth highest disposable income per person, with Clare in fourteenth place. The highest disposable incomes nationally are in Dublin, Kildare and Limerick. These, along with Wicklow, Meath and Cork, all had Disposable Income per person of more than €20,000 per annum. No Western Region county had a disposable income of more than more €19,000 per annum.
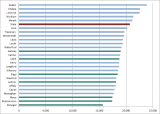
Figure 1: Disposable Income per Person for all Counties, Western Region and State, 2017.
Source: CSO, 2020, County Incomes and Regional GDP 2017
Trends over Time
It is also interesting to look at changes in disposable incomes over time. Figure 2 shows trends in disposable incomes in the Western Region between 2008 and 2018. All of the counties show the rapid decline from the 2008 peak followed by varying rates of recovery. There was a small peak in 2012 followed by a fall in 2013 which related to a decline in social transfers as discussed here. Galway consistently had the highest income in the region (with the exception of 2011 when Leitrim was highest). In contrast, disposable incomes in Clare had fallen to the 3rd lowest in the region in 2011 but have shown steady recovery since then and currently disposable incomes are second highest in the region.
Nationally, by 2017 seven counties [2] had returned to the income levels of 2008, but none of these was in the Western Region where no county had a higher Disposable Income per Person in 2017 than it did in 2008. The estimates for 2018 suggest that 11 counties will have disposable incomes above the 2008 peak, but again, none of these is in the Western Region.
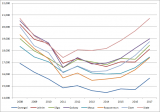
Figure 2: Disposable Income per Person for Western Region Counties 2008-2018 (€)
Source: CSO, 2020, County Incomes and Regional GDP 2017
Disposable Incomes in the Western Region compared to the State
When considering how counties are doing it is interesting to look back over a longer period, with data comparing counties to the state average available back to 2000 (Fig 3). While Figure 2 shows the Disposable Incomes per person, when considering the trends among counties it is helpful to use indices, so that county figures can be examined relative to the state (State=100). Thus Figure 3 provides a contrast to the more positive trends indicated above in Figure 2 which showed growth in disposable incomes in Western Region counties, particularly between 2014 and 2016. Growth rates in the Western Region were lower than for the state as a whole and so Figure 3 shows that Disposable Incomes in Western Region counties are declining relative to the state average.
The gap between counties in the Western Region and the rest for the most part narrowed (i.e. they got closer to the state average) during the boom period and into the slowdown. In fact, regional divergence was least in 2010 when all parts of the country were significantly affected by recession. Galway and Leitrim were the only Western Region counties to have a disposable incomes of higher than the state average during the period 2000–2017 (Galway in 2009 and 2010 and Leitrim in 2010). Since then, it is of concern that all Western Region counties, except Sligo, have declined relative to the state index of disposable income per person.
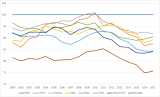
Figure 3: Index of Disposable Incomes per person in Western Region counties 2000-2017, State=100
Source: CSO, 2020, Statbank Table CIA02
Although disposable incomes in most Western Region counties was lower relative to the state in 2017 than in 2000, the pattern of change has varied among counties. Perhaps most significantly, the index for Clare was 96.5 relative to the state (100) in 2000 but by 2017 it had fallen to 90.5, though this was showing significant recovery on a low point of 88.9 of the state average in in 2015.
Roscommon (92.0) and Mayo (92.2) were in a similar position relative to the state in 2000, and both have declined significantly since then (Roscommon, 84.0, Mayo 84.2) though the pattern for both over time was different.
Sligo is the only Western Region county to have improved relative to the state between 2000 (88.9) and 2017 (89.1) though the difference is small, down from a peak of 95.5 in 2012. Similarly, Leitrim had only a very small change between 2000 and 2017 (87.9 to 87.5) but it had peaked at 100.6 in 2010.
Galway, which is often considered to be the engine of the region, also declined relative to the state, despite good performance to 2010, and having started in 2000 with an index of 94.2 relative the state, by 2017 it had fallen to 91.7, though this was the highest in the Western Region. Finally, the index of disposable income per person in Donegal, having started from a low base (81.4) continued to decline over the period to 75.6 in 2017 and has remained the lowest in the state during that period.
Ranking of counties
Another way to look at how the Western Region counties are doing is to compare them to other counties and rank the relative positions. In Figure 4, the rank of the Western Region counties is shown for four years (2000, 2006, 2011 and 2017).
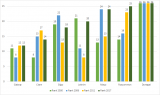
Figure 4: Rank of Disposable Income per Person in Western Region among all counties
Source: CSO, 2020, Statbank Table CIA02
Between 2000 and 2017, in the Western Region only Sligo (from 19 to 18) and Leitrim (from 21 to 20) improved their position relative to other counties, though Leitrim had experienced greater improvement in 2006 (ranked 11) and 2011 (ranked 8). There was significant variation in Sligo, falling as low as 22nd in 2006 and rising to 13th in 2011.
Galway did not vary significantly across the period (from position 11 in 2000 to 12 in 2017) while incomes in Clare, according to this measure, fell from 8th place in 2000 to 14 in 2017, having been as low as 17th in 2011.
The most significant changes were in Roscommon and Mayo which started in 13th (Mayo) and 14th (Roscommon) positions, but have fallen to the bottom three with disposable income per person in Mayo ranked 24th, Roscommon ranked 25th in 2017. Donegal has had the lowest disposable income of all counties for the whole period.
Conclusion
The relative declines in disposable incomes in Western Region counties is of concern. While incomes in the Western Region have grown, they are not increasing at the same rate as other counties.
Last year the CSO released Geographical Profiles of Income in Ireland 2016, a new, very comprehensive report on incomes in Ireland which provides data at both county and Electoral Division (ED) level (discussed in a WDC Insights blog here). In addition, new data Earnings Analysis Using Administrative Data Sources (EAADS) provides statistics on earnings at county level (findings for the Western Region are discussed here). This data, along with the Geographical Profiles of Income and the County Incomes data) gives us an opportunity to triangulate different data sources and gain a better understanding of patterns in earnings and some of the factors contributing to income differences in the region.
Having this data at county level will allow for a more nuanced understanding of the income situation and trends in the Western Region. I hope to have the opportunity to explore these further in the near future.
This post has provided a brief overview of the key County Income figures for the Western Region based on the recent CSO release. The growth and change in the regional economies as shown by the Regional GVA data will be examined in the next post.
Helen McHenry
[1] There can be quite significant variation between the preliminary and final figures.
[2] Limerick, Wicklow, Dublin, Kildare, Kerry, Westmeath and Tipperary