
//
Introduction
There is much discussion about the growth of ‘atypical’ forms of work – such as e-working, remote working, the gig, shared economy and temporary work etc.
The WDC has previously examined various aspects of atypical ways of working, identifying the extent to which it occurs in the Western Region, whether patterns differ to that elsewhere in the country, all aimed at informing labour market policy and identifying recommendations to support better employment opportunities in the Region.
The WDC Policy Briefing (No. 7) e-Working in the Western Region: A Review of the Evidence, examined the extent of e-work (also referred to as teleworking or remote working) in the Western Region, see here. Working at or from home can take different forms and this Policy Briefing examines e-working in traditional employer-employee relationships. The WDC also published case-studies of e-working in the Western Region which highlights a wide range of e-working experiences, see here.
A two page WDC Insights paper examined the gig or shared economy and how broadband and online platforms have enabled new forms of work and income generation to emerge. The paper examines the evidence on the extent to which Gig economy exists in the Western Region, download here.
In the third of the series, the WDC examined working from home. Based on Census of Population data which identifies whether people work ‘mainly at or from home’. The Census definition is self-assigned and can include those who work full-time from home or working from home on at least three days of a five day working week, see here. The WDC have suggested a change to Census 2021, to which the CSO has agreed, which will include a question asking people to list the number of days per week in which they work from home.
Agency Worker Employment
Another aspect of atypical working includes agency worker employment. Sometimes it is suggested that this type of employment is on the rise and is often less secure or more precarious than traditional employment forms. Agency work, especially that which is temporary, is often considered insecure employment. Is it a phenomenon largely associated with periods of high unemployment and a fragile economy where employers are reluctant to recruit permanent employees or is it a feature of the business model of some companies?
Research conducted for the European Parliament found evidence of an increase in temporary employment as a consequence of the global economic crash a decade ago. The report noted, The financial crisis and its aftermath has been one driver affecting risk of precariousness in Europe. As employers and employees find themselves operating in a more competitive and uncertain context post-crisis, new hirings have increasingly taken place on the basis of temporary and marginal part-time contracts. This rise in atypical contracting has meant that job insecurity has increased significantly in some countries, such as Portugal, Spain, Ireland, Latvia and Greece, involuntary temporary work has increased significantly in Ireland, but also in Latvia and involuntary part-time working has increased significantly in Italy, Lithuania, Spain, Ireland, Latvia and Greece. The link to the full report (5.4MB) is here.
Examining more recent data at a regional level in Ireland, the CSO provide a broad regional breakdown at NUTS 3 level. In this blogpost we review the latest CSO data on agency worker employment examining trends and how the regions compare, see here for full release published in August 2019.
CSO definition
The CSO Labour Force Survey captures the levels of agency workers by asking the following question of all employees in the LFS: Do you have a contract with an employment agency that placed you in your current job and your salary? Yes or No. Responses are therefore based on self-reporting.
Nationally, in Q4 2017, there were 56,200 employees classified as agency workers, and in Q1 2019 the number had decreased to 50,400, a decrease of 5,800.
Examining trends by region, the trends are somewhat different as graph 1 below shows. Both the Northern and Western region and the Eastern and Midland region have a somewhat similar trend, albeit at different levels, unsurprising given the relative size of the numbers employed in each region.
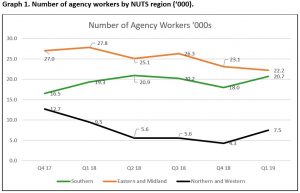
In the Northern and Western Region, (depicted by the black line), the numbers of agency workers at the start of the period was 12,700, there was a decline to 4,300 in Q4 2018 and at the end of the period (Q1 2019) it was 7,500. It should be noted that the LFS is a survey and the results are weighted to conform to population estimates broken down by age, sex and region. Where there are smaller numbers, estimates are considered to have a wider margin of error and so should be treated with caution. In the data above, this wider margin of error has occurred where numbers fall below 7,500.
The Eastern and Midland Region (the orange line), starts with a level of agency workers of 27,000 at the end of 2017. At the end of the period the number of agency workers in the Eastern and Midland region was 22,200.
The Southern region (green line), displays a different trend, starting at 16,500, rising to 20,900 in Q2 2018, dipping at the end of Q4 2018 and then rising again in Q1 2019 to 20,700. It is not clear why the trend in the Southern region is somewhat different and this will be discussed further below.
Regional Share of Agency Workers
Examining agency workers as a share and proportion of all employees, Graph 2 below shows the regional share of employees who are agency workers over the period Q4 2017 to Q1 2019.
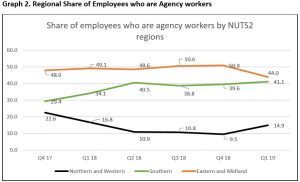
At the end of the period, in Q1 2019, the Northern & Western Region accounts for 14.9% of all agency workers in the country, the Southern Region accounts for 41.1% and the Eastern and Midland region accounts for 44%. The respective shares have changed over the last two years, with the Northern and Western Region accounting for a decreased share (22.6% in Q4 2017 to [14.9%] in Q1 2019. The Southern Region has increased its share (from 29.4% in 2017 to 41.1% in Q1 2019.
Proportion of employees who are agency workers
Given the different sizes of each regional labour market it is important to see the extent to which agency workers as a proportion of all employees, varies across time and region. This is illustrated in Graph 3 below.
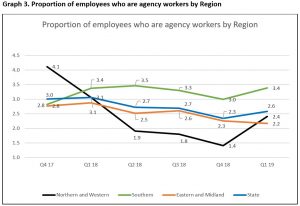
Nationally (depicted by the blue line), in Q4 2017 agency workers comprised 3% of all employees. This proportion declined to 2.6% at the start of 2019. Both the Northern and Western and Eastern and Midland regions had proportions below the national average.
The Northern and Western region, depicted by the black line, started the period with the highest proportion of employees as agency workers (4.1%), but this has since declined to 1.4% and was recorded at 2.4% in Q1 2019. The Eastern and Midland region trend (depicted by the orange line) is very similar to the national trend albeit at a lower level.
For most of the period, the proportion of employees who are agency workers is the highest in the Southern region (depicted by the green line). At the start of the period under review, Q4 2017, the rate in the Southern region is lower than the national figure – 2.8% and 3.0% respectively. However, from Q1 2018 through to the end of 2019 the proportion of employees that are agency workers is consistently higher in the Southern Region than the national average.
Conclusions
The Southern region comprises the Mid-West (Clare, Limerick & North Tipperary), the South-East (Carlow, Kilkenny, Waterford and Wexford) and the South-West (Cork and Kerry). In the absence of NUTS 3 regional data it is difficult to know whether there may be specific concentrations associated with a concentration in industry sectors that may be more prevalent in the Southern region.
The CSO data does provide other information on the profile of agency worker employment. For example, nationally 52% of agency workers are female. There is a sectoral concentration within the Agriculture, Forestry, Fishing, Industry and Construction sectors where a quarter of all agency employees are employed. There is also a high concentration of agency workers in the Human health and social work activities sector, see here for full release.
Discussions with the CSO indicate it is difficult to ascertain why there is a relatively high share in the Southern region. The CSO point out that the LFS is a survey, the margin of error of the estimates can be greater with smaller cell sizes. More trend data will be needed to see if it is a more established trend and a particularly stronger feature of employment in the Southern Region or if it becomes a stronger feature of employment when economic growth is not as strong.
However, the availability of these data does allow us to monitor trends and helps us build a picture of the range and types of employment, all of which is critical to formulating and improving employment policy.
Deirdre Frost