
Dr. Luke McGrath, economist with the Policy Analysis Team at the Western Development Commission (WDC) has compiled a set of Timely Economic Indicators (TEI) for the Western Region (WR) and wider Atlantic Economic Corridor (AEC).
In this Insights blog post, he provides a commentary on the latest report.
Before delving into the TEI indicators it is important to discuss the general economic outlook.
The domestic economy has rebounded strongly from the COVID-19 pandemic and the latest national economic projections still foresee continued economic growth during 2022 (Figure 1).
Figure 1. 2022 Economic Projections
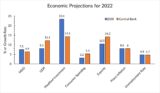
The economic projections, strong labour market performance, and large increases in tax revenues suggest that the Irish economy and public finances are in a relatively healthy state, but several key risks remain.
The first relates to the dual nature of the Irish economy. There have been differing fortunes for domestically-owned firms compared with foreign-owned multinationals. In particular, there has been a continuation of the pandemic period trend of growth and dominance of the foreign-owned Multinational Enterprise (MNE) sector contrasted with a stagnant or contracting domestic (other) sector (Figure 2). There are clearly globalisation impacts at play but these trends and continuation are remarkable nonetheless.
Figure 2. Gross Value Added (GVA) in Foreign-Owned MNE and “other” sectors 1995-2022 Q3.
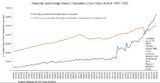
The latest national accounts show a contraction in domestically owned firms during Q3 2022. The Western Region is more reliant on domestically-owned enterprises. The contraction in the domestic sector has coincided with unemployment rates, in the Border region (Donegal, Sligo, Leitrim, Cavan, Monaghan & Louth) and West region (Galway, Mayo & Roscommon) being above the national average, as recorded in the Q3 2022 Labour Force Survey (LFS), for the first time since Q2 2020. More analysis and data are required given some of the health warnings with the regional LFS data but there is a risk of further regional divergence if the domestically owned sector declines.
More generally, Ireland is at risk from global slowdowns spilling over into domestic economic activity due to its nature as a small open economy. Slower national growth will likely translate into slower regional growth. The OECD November economic outlook sees global slowdowns through 2023 as tighter monetary policy and higher real interest rates, persistently high energy prices, weak real household income growth and declining confidence all bite.
The war in Ukraine has triggered a humanitarian disaster and driven food and energy prices up sharply to worsen pre-existing global supply chain problems resulting from the pandemic. These factors are contributing to broad-based annual price inflation to heights not seen for decades. The latest CSO data shows an 8.9% annual CPI inflation rate in November. High levels of inflation reduce household purchasing power and thus consumer spending is curtailed and will pose significant challenges for rural households. CSO analysis published in June has estimated that inflation developments in the year to March 2022 are likely to have affected rural households (as well as lower-income households) to a greater extent.
Labour Market
As the pandemic income supports schemes have wound down, the WR & AEC share of the labour force on the live register rose to 10% by August 2022, above the national average of 8.5%. Since then, there has been a decline. During November, the share of the labour force on the live register in the WR & AEC fell to 9%, above the national average of 8%. Higher regional shares of the labour force on the live register represent a continuation of a pre-pandemic trend related to regional economic & social structures.
Consumption
From January to October 2022, new car registrations rose 1-4% in the WR & AEC. Nationally, registrations were down 1%, year on year. July is a key month for car sales and a strong decline was recorded nationally (-25%) and in the WR (-9%) and AEC (-13%) compared with last July.
From January to October 2022, new goods vehicle registrations fell (17-20%) in the WR & AEC, year on year. Nationally, registrations fell 19%. Registrations during 2022 were above pre-pandemic 2019 levels in the WR & AEC. Nationally, registrations were down 8%.
Housing
The story of the housing market in 2021 was clear, housing demand held up well and continued to outpace supply thus prices have continued to rise. The supply of available houses for sale rose during 2021 but from an extremely low base. The sales and rental price patterns suggest the pandemic has coincided with movement away from larger urban areas. These trends have continued into 2022.
Median sales prices rose in all AEC counties when comparing YTD 2022 with 2021. Increases ranged from 8% in Galway to 26% in Leitrim. This data is limited as it does not account for size etc. and is only indicative of price changes. The official source is the Residential Property Price Index (RPPI) which is unavailable at the county level. The RPPI for September shows an annual increase in Dublin house prices of 10% compared with 12% in the rest of the State. Border (Cavan, Donegal, Leitrim, Monaghan, & Sligo) prices rose 12% and West (Galway, Mayo, Roscommon) prices rose 17%.
In the rental market, rents rose annually in all AEC counties during Q1 2022. Increases ranged from 6.1% in Galway city to 20% in Leitrim (the largest increase in the country). The national average increase in rents was 9.2%.
There have been encouraging signs in terms of housing supply growth for 2022 and there is likely to be mooted demand given rising interest rates and general inflation. A slowdown in house price growth is expected throughout 2022 and 2023. However, rising borrowing and material costs also threaten construction delays, the viability of residential units commenced, and the scale of investment in future units. There has been a considerable slowdown in residential commencements during 2022, a forward-looking indicator of supply (Figure 3).
Figure. 3 Residential Units Commencnced Rolling 12-month Index 2019-22.
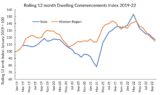
During the first nine months of 2022 there have been almost 21,000 completions. It is likely that total completions during 2022 will reach 25,000-28,000. 30,000 is the projected national housing demand as estimated by Bergin & García Rodríguez (2020). Lyons (2020) estimates a higher housing demand of closer to 50,000. The Government’s Housing for All strategy targets 24,600 new builds in 2022 and an average of 33,000 per year up to 2030.
It seems likely that the 2022 target will be met but, given the slowdown in housing commencements this year, at this stage, it seems unlikely that the government’s overall Housing For All new-build target for 2023 will be met.
The views expressed here are those of the author and do not necessarily represent or reflect the views of the WDC
Dr Luke McGrath
Economist
Policy Analysis Team