
The European Commission recently published the 8th Cohesion Report. The report is based on assessing EU Cohesion policy which has the objective of bringing Europe’s regions closer together in economic, social, and environmental spheres.
The report shows that, in general, less developed regions have been catching up, but that many transition regions have been caught in a “development trap” and that a growing innovation divide will make it harder for less developed and transition regions to catch up in the future. The report highlights that the green and digital transitions will be key drivers of future EU growth, but argues that, without appropriate policy action, new economic, social, and territorial disparities may appear.
This Insights Blog Post is the first in a series where I go through the detailed report, Chapter by Chapter, to provide regional insights.
In this first blog post of the series, I provide the background regional context for Ireland in terms of EU cohesion policy to help us understand and analyse the report in the proceeding blog posts.
EU Cohesion Policy and Regional Context for Ireland.
Cohesion policy is based on seven-year programming periods with funding for the 2014–20 period amounting to €352 billion, close to one-third of the total EU budget. The goal of EU Cohesion policy is to bring regions closer together thus a more favourable co-financing rate for Cohesion funding is provided to the less developed regions.
Cohesion Policy is delivered through specific funds:
- The European Regional Development Fund (ERDF), to invest in the social and economic development of all EU regions and cities.
- The Cohesion Fund (CF), to invest in environment and transport in the less prosperous EU countries.
- The European Social Fund Plus (ESF+), to support jobs and create a fair and socially inclusive society in EU countries.
- The Just Transition Fund (JTF) to support the regions most affected by the transition towards climate neutrality.
The European Commission classifies the development status of regions based on the Gross Domestic Product (GDP) per head of population, in purchasing power standards (PPS), relative to the EU-27 average.
There are three broad classifications for the regions for the 2021-2027 funding period:
- Less developed regions: where GDP per capita was less than 75% of the EU27 average.
- Transition regions: where GDP per capita was between 75% and 100% of the EU27 average.
- More developed regions: where GDP per capita was more than 100% of the EU27 average.
There have been considerable changes for the new funding period both in terms of how EU regions are classified for funding as well as the geographic composition of Ireland’s regions.
Considerable Changes for the 2021-27 Funding Period.
Under the 2014-2020 period, a more developed region was one whose GDP per capita was greater than or equal to 90% of the EU average. For the 2021-27 period the threshold has increased to 100% of the EU average.
The geographical classification system the EU uses is referred to as the Nomenclature of Territorial Units for Statistics (NUTS).
For the 2014-2020 funding period there were two Irish NUTS2 regions:
- Border, Midland & Western (Donegal, Louth, Cavan, Monaghan, Sligo, Leitrim Galway, Mayo, Roscommon, Laois, Longford, Offaly, and Westmeath).
- Southern & Eastern (Dublin, Cork, Kerry, Carlow, Kilkenny, Tipperary, Waterford, Wexford, Limerick, Clare, Kildare, Meath, Wicklow).
Both Irish NUTS2 regions had been classified as more developed regions as GDP per capita was above 90% in the reference period used to classify the regions. The geographical composition of Irish NUTS regions has since changed and given legal status in 2016 and thus for the new funding period these new NUTS regions are used.
There are now three Irish NUTS2 regions rather than two:
- NUTS2 Northern & Western composed of NUTS3 West (Galway, Mayo, Roscommon) and NUTS3 Border (Donegal, Sligo, Leitrim, Cavan, Monaghan).
- NUTS2 Southern composed of NUTS3 Mid-West (Clare, Limerick, Tipperary), NUTS3 South East (Wexford, Waterford, Carlow, Kilkenny) and NUTS3 South West (Cork, Kerry).
- NUTS2 Eastern & Midland composed of NUTS3 Dublin, NUTS3 Mid-East (Wicklow, Kildare, Meath, Louth) and NUTS3 Midlands (Offaly, Laois, Westmeath, Longford).
For the 2021-27 funding period, the regional development classifications were based on relative GDP levels in the latest 3-year period for which data was available (i.e., 2015-2017). Northern & Western GDP averaged 85% of the EU average from 2015-2017 and thus was classified as a transition region. Eastern & Midland and Southern were both classified as more developed.
Figure 1 shows Irish NUTS3 GDP per capita (PPS) relative to the EU-27 average from 2008-19. Northern & Western averaged 84.5% of the EU average over the entire period and has been below 80% since 2016. There was no year where the Northern & Western region reached 100% of the EU average.
Figure 1 also reveals a large distortion in the Irish regional GDP data. A level shift in GDP was observed from 2014-15 that heavily impacted the Southern region and to a lesser extent in the Eastern & Midland region. See a previous Insights blog for more detail.
Figure 1. GDP per capita (PPS) in Irish NUTS3 regions relative to the EU-27 average from 2008-19.
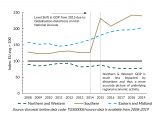
Eastern & Midland and Southern have both been well above the EU average over the 2008-19 period. Despite the large macroeconomic distortions in the data, it seems reasonable that underlying economic activity in both regions is above the EU average. However, one must seriously doubt the levels of economic activity recorded and thus the degree to which these regions are above the EU average. For example, in 2019, the Southern region’s GDP per capita was estimated to be 240% of the EU average compared to 127% in 2014. While it is reasonable to think the underlying activity was above the EU average, it is implausible that it reached 240%.
Figure 2 shows the old NUTS3 Regions relative to the EU average from 2000-15. We can see that the old Border, Midland and Western region was below 90% of the EU average since 2009, having been above 90% from 2001-09 and above 100% from 2004-09.
Figure 2. GDP Per Capita in “old” NUTS3 Regions relative to the EU average from 2000-15.
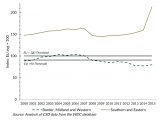
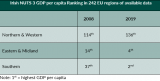
Table 1 shows the relative ranking of the Irish NUTS3 regions within the 242 EU NUTS3 regions, in terms of GDP per capita, that had data in both 2008 and 2019. The Northern & Western Region declined from 114th in 2008 to 136th in 2019. The other two Irish regions have both improved but, as noted above, those rankings, particularly for the Southern region, are likely to be heavily biased.
Table 1. Ranking of the Irish NUTS3 regions in terms of GDP per capita within the EU: 2008 & 2019.
Given the level of macroeconomic distortions in the GDP data, what inferences can we draw about Irish regional development over the last decade or so?
Well, in terms of underlying activity there is evidence, across several additional economic metrics, to suggest a divergence for the Northern & Western Region from the national and EU average. One example is the disposable household (HH) income data which is not subject to the same level of distortions as the GDP data.
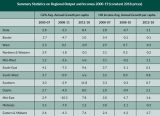
Table 2 provides a breakdown of Gross Value Added (GVA), closely related to GDP as well as HH income for the NUTS2 and NUTS3 regions from 2000-18. National growth in HH incomes was much lower than the growth recorded in the distorted GVA figures.
For example, real national GVA growth per capita averaged 8.4% per year from 2012-18 compared with per capita household income growth of 1.1% per year. However, regional divergence is still evident in the HH income data. For example, HH income in the Northern & Western Region declined by 0.2% from 2012-18 in real terms and was almost identical to the 0.1% decline in GVA.
Recent research from the WDC policy analysis team goes into the finer details (McGrath, 2021; McGrath, Frost & McHenry, 2021).
Table 2. Key Regional Economic Metrics 2000-18
Now that I have set out the regional context in Ireland in relation to EU Cohesion Policy future Blog Posts will analyse the Cohesion report.
The views expressed here are those of the author and do not necessarily represent or reflect the views of the WDC.
Dr Luke McGrath
Economist
Policy Analysis Team