//
Data on earnings of employees in different counties has just been released by the CSO, providing another important contribution to our understanding of local and regional economic development.
Earnings Analysis Using Administrative Data Sources (EAADS) provides statistics on earnings for which the primary data source is the Revenue Commissioner’s P35L dataset of employee annual earnings which is linked to CSO and other data to provide economic and demographic characteristics. This new data, along with the Geographical Profiles of Income (also released for the first time this year and discussed on the blog here) and the County Incomes data (discussed here) gives us an opportunity to triangulate different data and gain a better understanding of patterns in earnings and some of the factors contributing to income differences in the region. Having this data at county level allows for a more nuanced understanding of the situation and trends in the Western Region.
In this post the EADDS annual earnings data is discussed for Western Region counties. It should be remembered that this data is specifically employee earnings data which is just one element of individual or household incomes. Other incomes sources (e.g. social welfare, earnings from wealth or profits from business) are not included in this data set.
Annual Earnings, 2018
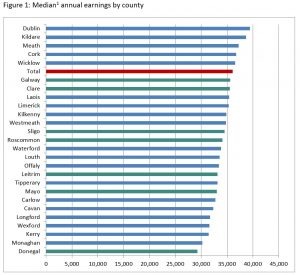
Looking first at median[1] annual earnings[2] for 2018 (Figure 1), even though all Western Region counties (green) are below the national figure of €36,095 both Galway (€35,632) and Clare (€35,568) are only slightly below, in sixth and seventh place nationally.
Note Total includes Northern Ireland counties not listed above.
Source: CSO Ireland, 2019, Earnings Analysis Using Administrative Data Sources Table 8.15 Median1 annual earnings by county and sex 2018
Donegal had the lowest earnings (€29,298), almost a thousand euro less than Monaghan, the next highest, and more than €10,000 less than the earnings in Dublin (the highest county (€39,408). Earnings in Roscommon are higher than might have been expected (€34,082, 13th place) from other data such as that for County Incomes, though in line with Geographical Profiles of Income.
Annual Earnings in Western Region counties
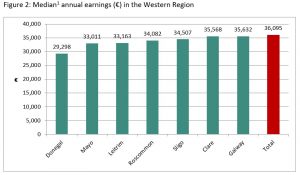
Focussing more specifically on the range of earnings per employee in the Western Region (Figure 2), the gap between the lowest (Donegal) and the highest (Galway) is a €6,334 per year while annual earnings in Mayo and Leitrim are both around €2,500 less than in Galway. There is only €64 difference in the annual median income per person in Clare and Galway.
Note Total includes Northern Ireland counties not listed above.
Source: CSO Ireland, 2019, Earnings Analysis Using Administrative Data Sources Table 8.15 Median1 annual earnings by county and sex 2018
Changes in Mean Earnings 2016-2018
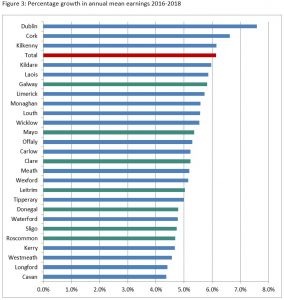
This data is available for the years 2016, 2017 and 2018. While this covers a relatively short period it is interesting to examine the change in mean[3] annual earnings over this period throughout Ireland (Figure 3). Nationally earnings grew by 6.1% over the period with the highest growth rate in Dublin (7.6%) followed by Cork (6.6%) and Kilkenny (6.2%). The lowest rates of growth were in Cavan (4.4% and Longford (4.4%).
Note: Total includes Northern Ireland counties not listed above.
Source: CSO Ireland, 2019, Earnings Analysis Using Administrative Data Sources Table 8.14 Mean annual earnings by county and sex
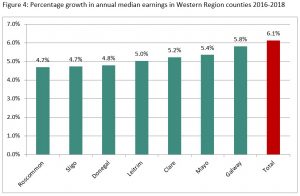
Looking more closely at the Western Region (Figure 4), the highest rate of earnings growth was in
Galway (5.8%), and the lowest in Roscommon (4.7%) and Sligo (4.7%). No Western Region county had earnings growth higher than the national rate.
Note: Total includes Northern Ireland counties not listed above.
Source: CSO Ireland, 2019, Earnings Analysis Using Administrative Data Sources Table 8.14 Mean annual earnings by county and sex
Gender Differences in Earnings
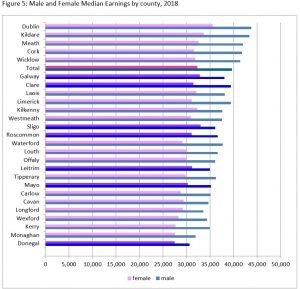
County data is also available by sex, so it is possible to compare earnings in each county for males and females (Figure 5). In all counties male earnings were higher than female earnings in 2018, with the largest difference in Cork, a very significant €10,205 per year (female earnings were only 76% of male). Nationally the difference between male and female earnings was €7,394 and the smallest difference in both amount and proportion was in Donegal (€3,153, female earnings 90% of male). In general, the largest differences between male and female earnings were in the highest earning counties, but Waterford (€8,511), Limerick (€8,318) and Kerry (€7,234), which has the third lowest medial annual earnings, were exceptions to this.
Source: Source: CSO Ireland, 2019, Earnings Analysis Using Administrative Data Sources Table 8.15 Median annual earnings by county and sex
Gender Differences in Earnings in the Western Region
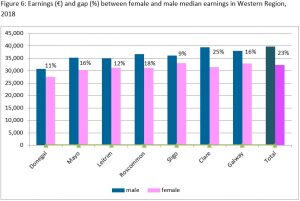
The difference between male and female earnings was smallest in the Western Region. Six of the nine counties where female earnings were 85% or more of male earnings were in our Region. Sligo had the narrowest gap nationally (female earnings 91% of male), followed by Donegal (90%), Leitrim (89%), Galway and Mayo (86%) and Roscommon (85%)[4]. Clare was the exception in the region, with female earnings only 80% of male earnings.
The difference in the Western Region are shown more clearly in Figure 6 which highlights the earnings gap (percentage difference in what females earn compared to males). Clearly Sligo (9%) and Donegal (11%) perform best. Nationally the picture is bleaker with a 23% annual earnings gap, and in Clare males earn 25% more than females.
Source: Source: CSO Ireland, 2019, Earnings Analysis Using Administrative Data Sources Table 8.15 Median annual earnings by county and sex
Some of this earnings gap is likely to be accounted for by the higher instance of part time working among females. The differences may also relate to earning levels in the different sectors where men and women tend to work, as well as differences in employment types. Nonetheless, the gap in earnings is very significant but, at least in relation to this statistic, the Western Region is a good performer. The prevalence of public sector employment in the Western Region (discussed here), along with employment in Education (3 out of 4 people working in the Education sector in the Western Region are women) and Health (21.4% of all working women in the Western Region work in Health & Care, it is the largest employment sector for women in the region), probably influences this.
Changes in male and female earnings over time.
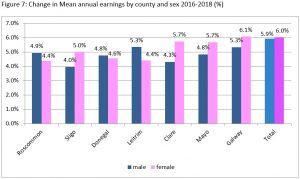
There is no clear pattern for the growth in mean earnings for males and females between 2016 and 2018 in the Western Region counties (Figure 7 below). In four of the seven Western Region counties female earnings increased by more than male earnings between 2016 and 2018. This was also the situation nationally (though the difference is small (0.1%)). Female earnings in Sligo grew by 5.0% while male earnings in the same period grew by 4.0%. In Clare the difference in earnings growth was more significant (5.7% for females and 4.3% for males). Galway had the largest growth in female earnings over the period in the region at 6.1%, while male earnings grew by 5.3%. If this pattern were to continue the gap in male and female earnings would narrow, or even disappear.
Source: Source: CSO Ireland, 2019, Earnings Analysis Using Administrative Data Sources Table 8.14 Mean annual earnings by county and sex
In contrast in three Western Region counties (and a total of nine counties nationally) male earnings grew by more than female earnings between 2016 and 2018. Leitrim and Roscommon had the lowest female earning growth (4.4%) in the region and nationally. The difference was most significant in Leitrim where male earnings grew by 5.3% over the same period. In Donegal the difference was less marked (4.8% for males and 4.6% for females). Unlike the other Western Region counties discussed above, if this pattern persists in these counties the gap in male and female earnings will widen.
Conclusion
This data set is focused on earning for those in employment rather than broader income data covering households or adults not in employment so it does not give a full picture of income levels. It is, nonetheless, very useful to have this data at county level. We can now make robust comparisons between counties and see some of the changes over time. In future analysis it may be possible to consider in more depth how the different employment patterns and sectors in the counties in turn influence earnings. Similarly correlations between education and training levels, and skill sets in the counties will help us better understand the needs and opportunities for counties and regions.
In the New Year I hope to have time to compare the data in this release with the other income data available at county level to get a better understanding of what each source is telling us about the trends and differences in the earnings and incomes in the Western Region.
Helen McHenry
[1] 1Median annual earnings: Half of the employees earn more than this amount and half earn less. Median is used as it reduces the influence of outliers, in particular exceptionally high earners who could increase the mean significantly.
[2] Employees who worked for less than 50 weeks in the reference year are excluded from the calculations for annual earnings. This is done to improve comparability of the data over time.
[3] Mean is used here for comparison over time to maintain consistency with gender data discussed later.
[4] Monaghan (86%), Cavan (85%) and Kilkenny (85%) were the other counties.

