
The Central Statistics Office (CSO) has released County Incomes and Regional GDP for 2020.
Dr Luke McGrath, economist with the WDC Policy Analysis Team, will be releasing a series of WDC Insights Blog Posts to provide an overview of the CSO release.
In this post, Luke examines trends in disposable incomes across our region. Before delving into the analysis, the obligatory health warning should be noted – “county calculations for disposable income are estimates and involve a certain degree of uncertainty, however, despite the uncertainty disposable income per capita allow us to visualise discrepancies in income between regions and counties” CSO (2023).
The CSO release provides official estimates of county-level disposable household income (gross household income less total tax, social insurance contributions & inter-household transfers paid) for 2020 as well as a preliminary estimate for 2021. The preliminary estimates are often subject to sizeable revisions thus this post will focus on the more reliable official estimates from 2000-20.
Figure 1 maps household disposable income per person in 2020. It shows that the highest disposable incomes were in the east and south. The highest disposable income per person was in Dublin which, along with Limerick, Cork & Kildare had per capita disposable income greater than the state average while Wicklow, Westmeath and Meath were just below.
The lowest disposable incomes were in the North-West and Midlands. Donegal had the lowest disposable income per person closely followed by Longford, Offaly & Laois. In 2020, two Western Region counties (Donegal & Mayo) were in the bottom ten. This represents an improvement from the 2013- 19 period where it was typical for four Western Region counties to be in the bottom ten, with as many as five in 2016.
Figure 1 – Map of Disposable Household Income by County.
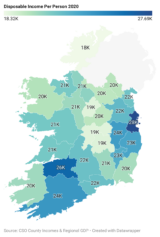
Source: WDC Analysis
Table 1 provides summary statistics for each of the Western Region counties. During 2020, disposable incomes in our region ranged from €18,332 in Donegal to €21,437 in Galway compared to the national average of €23,460. The CSO data goes back to the year 2000, Table 1 shows Leitrim and Sligo are the only two Western Region counties that have increased their relative share of the national average since 2000 (Leitrim from 88% to 89% and Sligo from 89% to 91%). Mayo and Clare have recorded the largest relative declines since 2000 (Mayo from 92% to 85% and Clare from 97% to 91%)
Table 1 Household Incomes across the Western Region: Summary Statistics.

Source: WDC Analysis
Note: All figures are in nominal terms.
Table 2 shows the relative ranking of the 26 counties in terms of disposable income per person for 2020. Western Region counties are generally clustered around the middle of the rankings, with Donegal at the bottom.
Table 2 Ranking Disposable Incomes in the State – 2020.

Source: WDC Analysis
Since 2000, there has been considerable growth in nominal disposable incomes, followed by sharp declines across the country during the recessionary period starting in 2009. The income falls during the recession took over a decade to recover from. By 2018, Sligo and just 6 other counties (Dublin, Cork, Kerry, Kildare, Limerick & Wicklow) held nominal disposable incomes at or above their 2008 level. By 2019, Donegal, Mayo, & Sligo and by 2020, Galway, Roscommon & Leitrim reached or exceeded their 2008 levels.
Even in 2020, 4 counties still held nominal disposable income per person below their 2008 level (Wexford, Longford, Laois & Cavan)
Figure 2 Household Incomes in the State and the Western Region counties 2000-2020.
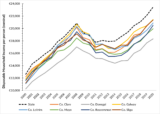
Source: WDC Analysis
While incomes have grown across the Western Region since the recession, growth has been slower than the national average. Slower growth has meant a general divergence from the national average across the Western Region since 2011 (Figure 3). However, from 2014/15 to 2020 there was an improvement in Sligo, Roscommon, and Clare.
In general, the gap between the disposable income per person in the Western Region counties and the State average narrowed during the economic boom period and into the slowdown. Back in 2000, four Western Region counties were above 90% of the national average: Clare (97%), Galway (94%), Mayo (92%) & Roscommon (92%). In 2020, three Western Region counties were above 90% of the national average: Galway (91%), Clare (91%) & Sligo (91%).
Regional income imbalance was least in 2010 when all parts of the country were significantly negatively affected by the recession (Table 3). For example, the only instances during 2000-20 when Western Region counties held disposable incomes higher than the state average occurred when incomes were collapsing across the country i.e., in 2009 (Galway) and 2010 (Galway and Leitrim). This highlights some of the complexities that surround the issue of regional inequality. Between 2000-20 regional income imbalance was at its lowest at a time when incomes fell sharply across the Western Region but just at a slower rate than the national collapse thus this could hardly be championed. From a regional development perspective, we would much rather see regional imbalances closed through regional growth outpacing national growth i.e., incomes would still be rising across the country.
Figure 3 Household Incomes in the Western Region relative to the State average 2000-20.
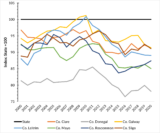
Source: WDC Analysis
Slower growth in incomes across the Western Region is related to structural issues such as, infrastructure deficits, a greater reliance on the slower-growing public sector, low graduate retention rates and less employment in the higher-wage, faster-growing Knowledge Intensive Services sectors such as ICT (See Lydon & McGrath 2020; McGrath, 2021 and McGrath, Frost & McHenry 2021).
It should be noted that some of the divergences from the state average is a result of sharp growth in Dublin pushing up the national average. While there has been a general divergence from the State average in monetary terms, some Western Region counties have improved their relative rankings, considerably. Table 3 shows that Leitrim improved from 21st to 14th and Sligo from 19th to 13th from 2000-20.
There has, however, been a divergence from the state average coupled with considerable declines in absolute rankings in Mayo where the county moved from 12th to 19th, and in Clare from 8th to 12th from 2000-20.
Table 3 Ranking of Western Region counties, Disposable Income per person, 2000, 2010 & 2020.

Source: WDC Analysis
This post has provided a brief overview of the key County Income figures for the Western Region based on the recent CSO release. The relative decline in disposable incomes across the Western Region counties is of concern. While incomes in the Western Region have grown, they are not increasing at the same rate as in other counties.
The dual shocks of COVID-19 and Brexit have exacerbated pre-pandemic structural issues in our region that future policy must address through the reduction of regional infrastructure deficits and broader support for the ‘3Es’ of enterprise, employment, and education to enable regions to make the most of their assets.
Given low levels of historical investment there is a clear need to improve regional connectivity and accessibility. A key constraint for regional entrepreneurs is the lack of physical and digital infrastructure.
The growth and change in the regional economies as shown by the Regional GVA data will be examined in the next post in the series.
The views expressed here are those of the author and do not necessarily represent or reflect the views of the WDC
Dr Luke McGrath
Economist
Policy Analysis Team