Human Resource
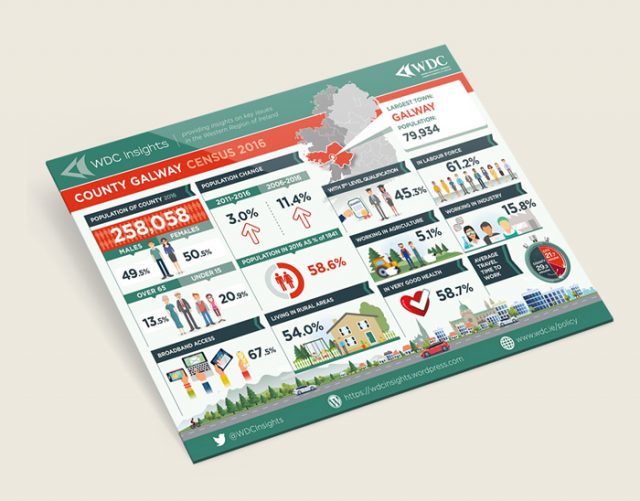
| County Population 2022 | 277,737 |
| Population Change (2016-2022) | 7.6% |
Key Centres of Population
| Built Up Areas with Population over 1,000 (2022) | |
| Galway city and suburbs, Co Galway | 85,910 |
| Tuam, Co Galway | 9,647 |
| Ballinasloe, Co Galway | 6,597 |
| Loughrea, Co Galway | 6,322 |
| Oranmore, Co Galway | 5,819 |
| Athenry, Co Galway | 4,603 |
| Gort, Co Galway | 2,870 |
| Bearna, Co Galway | 2,336 |
| Maigh Cuilinn, Co Galway | 2,279 |
| Oughterard, Co Galway | 1,846 |
| Portumna, Co Galway | 1,690 |
| Baile Chláir, Co Galway | 1,632 |
| Clifden, Co Galway | 1,259 |
| Headford, Co Galway | 1,235 |
| Craughwell, Co Galway | 1,034 |
Source: CSO Census of Population 2022, Built Up Areas
Highest level of education completed by persons whose education has ceased (%)
| 2022 | |
| No Formal/Primary | 10.0% |
| Secondary | 38.3% |
| Third Level | 51.6% |
Source CSO Census of Population 2022
Natural Resources
| Average Farm Size (AAU) 2020 | 26.5 ha |
| Farming, Fishing & Forestry workers (2022) | 5,065 |
Employment
| Employed* (2022) | 125,519 |
| Employment Change (2016-2022) | 12.3% |
| Labour Force Participation Rate (2022) | 60.8% |
| *Employed (incudes not stated, excludes unemployed) |
Numbers Employed by Sector (2022)*
| Total in Employment | 117,251 |
| Agriculture, Forestry & Fishing | 5,065 (4.3%) |
| Industry & Construction | 27,553 (23.5%) |
| Services | 84,633 (72.2%) |
Source: CSO Census of Population 2022
Download the 2-page WDC Insights Galway City’s Labour Market – Census 2016
Download the 2-page WDC Insights Galway County’s Labour Market – Census 2016
Agency Assisted Employment (2022)
| Permanent Full Time Employment in Agency Assisted Companies | 32,568 |
Source: DETE, Annual Employment Survey 2022
Local Sustainability
| Fertility Rate (2022)* | 11.0 |
| Proportion of seats held by women in the 2019 local election** | 21.1% |
| Domestic Building Energy Ratings (BER) % Grade B2 and above (2023)*** | 13.5% |
* Births per year per 1,000 population. Source: CSO Vital Statistics Yearly Summary (Galway city and county own calculation)
**Source: Department of Housing, Planning and Local Government, Local Elections 2019 Results, Transfer of Votes and Statistics
*** Source: CSO Domestic Buildings Energy Ratings
Income and Earnings
| Average Disposable Income per Person 2021* | €23,495 |
| Mean Annual Earnings 2021** | €47,618 |
* Source: CSO County Incomes and Regional GDP
**Source: CSO Ireland, Earnings Analysis using Administrative Data Sources.
Business Economy
| Number of Active Enterprises | 19,967 |
| Percentage of Micro-Enterprises (10 or fewer employees) | 92.9% |
| Percentage Change in Number of Enterprises (2019-2021) | 11.6% |
Source: CSO Business Demography 2021
.
Labour Catchments in County Galway (2016)*
Download the 2-page county profile of Galway City’s Place of Residence and Place of Work, 2011 and 2016
Download the 2-page county profile of Galway County’s Place of Residence and Place of Work, 2011 and 2016
| Galway city labour catchment | 70,170 (2016), 64,455 (2006) |
|---|---|
| Ballinasloe labour catchment | 4,804**(2016), 5,135 (2006) |
| Tuam labour catchment | 5,506 (2016), 3,015 (2006) |
| Loughrea labour catchment | 3,070 (2016), 2,311 (2006) |
| Clifden labour catchment | 2,100 (2016), 1,845 (2006) |
| Gort labour catchment | 1,329 (2016), 1,505 (2006) |
* The labour catchment of a town is that area from which it draws most of its workforce. These figures are the number of workers living in the catchment areas of these towns.
** Part of the Ballinasloe labour catchment extends beyond the boundary of the Western Region and is not fully captured here.
