

Matthew Sweeney, University of Galway student, on work placement with the WDC Policy Analysis Team has been examining regional housing trends.
In this blog, Matthew details regional trends across various housing supply indicators and concludes with estimates of the extent to which housing supply is meeting projected housing demand.
Residential Dwelling Completions
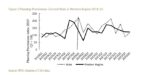
Figures 1 and 2 represent data on new residential dwelling unit completions in the Western Region and the State from 2011-22, by quarter.
Coinciding with the downturn in the construction sector, there was a consistent trend of falling completions across the Western Region and the State from 2011-15.
Completions averaged 1,309 in the Western Region from 2011-15 falling from 1,854 in 2011 to 1,109 in 2014. The State average was 5,843 over the same period falling from 6,994 to 4,575.
As the construction sector began to recover, consistent rises in annual completions emerged from 2015-19 both nationally and in the Western Region. From 2015-19, completions averaged 1,828 in the Western Region and 14,072 in the State over the same period.
During 2019, just prior to the pandemic, the Western Region recorded 2,621 completions and 21,130 completions were recorded nationally. The historical changes in regional housing is discussed in more detail in McGrath (2022a).
The initial pandemic impact was a sharp contraction during Q2 2020 due to the public health restrictions that resulted in shutdowns across the construction sector. A 21% reduction in completions between 2019 Q2 and 2020 Q2 was recorded in the Western Region and a 33% reduction in the State.
As the construction sector re-opened, completions reached new peaks in 2022 with 3,484 in the Western Region and 29,851 in the State overall.
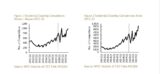
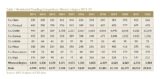
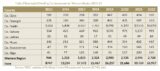
Table 1 breaks down annual dwelling completions by Western Region county, Dublin, and the State from 2011-22, annually. Consistent with the regional data, all counties in the Region had a considerable decline in completions between 2011-15. The largest decline was seen in Sligo which had a 49% decline in completions during that time. Galway observed an 18% decline, the smallest in the Region. Contrary to the Western Region, Dublin had a 120% increase over that time.
From 2015-19 most counties saw increases in completions, in-line with the regional trend. Galway saw the largest increase in the region of 169%, a 228% increase was observed in Dublin. Leitrim had a 27% decline, an outlier to the regional trend over that period.
2020 saw declines in all counties from Q1 but most counties finished the year with an overall increase in completions from the previous year. Donegal, Clare, Roscommon and Sligo all saw increases, the most being in Sligo which had a 48% increase in completions during 2020-21. Leitrim and Mayo had decreases in completions, following the same trend as the State. The most being in Mayo which observed a 6% decline over that period. Dublin also saw declines of 13%.
The recovery from the pandemic saw large increases from 2020-22. The largest increases were in Leitrim, which observed an 82% increase in completions. Roscommon had a 4% increase in that time, the lowest in the region. As mentioned earlier, the rising completions trend in the region and the State overall is threatened by rising material and borrowing costs.
Residential Dwelling Commencements
Commencement notices eventually translate into completions, usually with a 12–24-month lag. Consequently, commencements offer a good forward-looking indicator of housing supply.
Figure 3 represents 12 month rolling dwelling commencements notices, indexed to 2019, for the State and the Western Region from 2015-22.
As the construction sector began to recover off the back off the housing bust, consistent rises in commencements emerged from 2015 across the Western Region and the State. A similar trend was recorded in the completions data, as discussed above.
Commencements averaged 2,094 in the Western Region from 2015-19 and 19,877 in the State over the same period. During 2019, just prior to the pandemic, the Western Region recorded 2,621 commencements with 21,130 commencements recorded nationally.
The initial pandemic impact saw a sharp contraction in commencements nationally (a fall of 33% from March 2020 to March 2021). The national decline was largely driven by a sharp contraction in Dublin. A less severe contraction was observed in the Western Region (a 9% fall over the same period).
As Government restrictions on the construction sector eased, commencements rose sharply up to April 2022. From March 2021 to March 2022, commencements increased by 97% nationally and 30% in the Western Region.
From April 2022 to March 2023, there has been a general and sharp decline with commencements returning to pre-pandemic levels in the Western Region and nationally.
The slowdown in commencements is likely related to rising interest rates and building material costs. (McGrath 2022b).
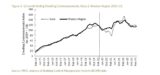
Figure 4 below displays the total rolling 12-months of commencement notices in the State from February 2015 to March 2023.
From this, we see a clear drop off in commencements at the start of the pandemic period. For example, a fall from around 27,000 during 2019 to 17,000 during the 12 months to March 2021. We then see a recovery with up to 35,000 notices recorded in the 12 months to March 2022. More recently, there has been a decline to just over 27,000 in the 12 months to March 2023.
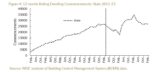
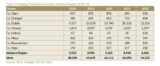
Table 2 displays the number of commencement notices annually from 2015-22 in each Western Region county, Dublin, and the State.
Commencements in the Western Region and the State declined overall from 2021-22. Within the Western Region, Sligo had the largest percentage decline (25%). Donegal (1%), Mayo (15%) and Leitrim (71%) all recorded increases. However, it should be noted that due to the small overall volumes recorded in Leitrim, small changes in the absolute number of commencements can lead to large percentage changes.
Planning Permissions
Figure 5 illustrates quarterly units for which planning permission has been granted in the State and the Western Region, indexed to Q1 2019.
In line with the trends observed across commencements and completions, planning permissions granted declined sharply at the onset of the pandemic, by 67% in the Western Region from 2019 Q4 to 2020 Q4 and by 42% in the State during the same period.
2021 Q1-2022 Q1 saw a 19% increase in planning permissions granted in the Western Region and an increase of 3.2% in the State overall, as restrictions eased.
Since then, there has been a decline in both the State and in the Western Region. The amount of planning permissions granted are down 36% in the Western Region and 37% in the State from Q4 2019 to Q4 2022.
The county data tells a more mixed story than the regional data (Table 3). From 2021-22, there were increases in Donegal (7%), Leitrim (22%) and Sligo (30%). In contrast, there were declines in Mayo (28%), Galway (20%) and Roscommon (23%). Clare remained unchanged.
Supply and Demand
Above, I discussed key trends across various housing supply indicators. An estimation for the degree to which housing supply is meeting housing demand can be obtained using the dwelling completion data and the projected housing demand estimates for 2017 and 2021 contained in Bergin & Garcia Rodriguez (2020).
Figure 6 shows the share of projected housing demand met by residential unit completions in 2021 at the county level.
Nationally, 67% of the projected housing demand by Bergin & Garcia Rodriguez was met in 2021. Supply did not meet projected demand in any Western Region county during 2021. The highest share in the region was recorded in Mayo (86%) and the lowest share was in Sligo (31%), the lowest share recorded nationally.
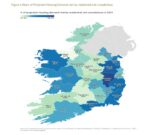
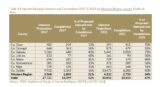
Table 4 shows the detailed results for the Western Region counties, Dublin, and the State for both 2017 and 2021. Comparing 2021 to 2017, we observe the share of projected demand met by completions increasing, in general, across the State and the Western Region counties.
The exceptions, within the Western Region, were in Leitrim where the share fell from 68% to 56% and in Sligo where the share fell from 33% to 31%. The largest increases in the Western Region were recorded in Galway (48% to 73%) and Clare (53% to 70%).
In general, there have been improvements in relation to the share of projected housing demand being met by completions. For example, nationally, the share was 52% in 2017 and 67% in 2021. However, supply is still falling short of projected demand as estimated by Bergin & Garcia Rodriguez (2020). This raises concerns of reaching the Governments Housing For All Targets which were heavily influenced by Bergin & Garcia Rodriguez. The Housing for All strategy targets 33,000 new units, on average, per annum up to and including 2030.
2022 completions met the ‘Housing for All’ target of 24,600, as there were 29,851 completions. However, there are concerns that the 2023 target will not be reached given the slowdown in commencements noted above.
The Housing for All targets align with Bergin & Garcia Rodriguez’s projections of housing demand of 24,000-32,000 new units per year up to 2040. However, it should be noted that (Lyons 2020) estimated much higher housing demand in the Region, 48,000-62,000 dwellings per annum up to 2040.
Matthew Sweeney
University of Galway Student (BA Government)
Work placement with the Policy Analysis Team
The views expressed here are those of the author and do not necessarily represent or reflect the views of the WDC.