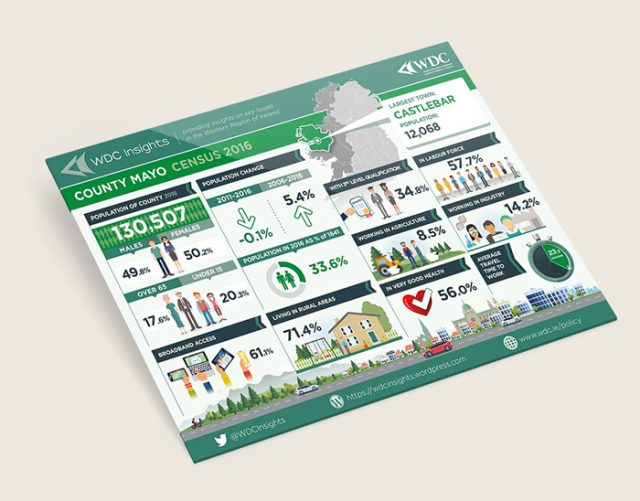
Human Resource
| County Population 2022 | 137,970 |
| Population Change (2016-2022) | 5.7% |
Key Centres of Population
| Built Up Areas with population > 1,000 (2022) | |
| Castlebar, Co Mayo | 13,054 |
| Ballina, Co Mayo | 10,556 |
| Westport, Co Mayo | 6,872 |
| Claremorris, Co Mayo | 3,857 |
| Ballinrobe, Co Mayo | 3,148 |
| Ballyhaunis, Co Mayo | 2,773 |
| Swinford, Co Mayo | 1,459 |
| Foxford, Co Mayo | 1,452 |
| Kiltimagh, Co Mayo | 1,232 |
| Charlestown-Bellahy, Counties Mayo & Sligo | 1,172 |
| Crossmolina, Co Mayo | 1,134 |
| Béal An Mhuirthead, Co Mayo | 1,042 |
| Knock, Co Mayo | 1,029 |
Source: CSO Census of Population 2022, Built Up Areas
Highest level of education completed by persons whose education has ceased (%)
| 2022 | |
| No Formal/Primary | 13.6% |
| Secondary | 45.1% |
| Third Level | 41.2% |
Source: CSO Census of Population 2022
Natural Resources
| Average Farm Size (AAU) 2020 | 23.4 ha |
| Farming, Fishing & Forestry workers (2022) | 3,607 (6.5%) |
Employment
| Persons at work pop aged 15 years and over | |
| Employed* (2022) | 58,334 |
| Employment Change (2016-2022) | 13.40% |
| Labour Force Participation on Rate (2022) | 57.4 |
Source: CSO Census of Population 2022 *includes not stated, excludes unemployed
Numbers Employed by Sector (2022)
| Numbers Employed by Sector (2022)* | |
| Total | 55,299 |
| Agriculture, Forestry & Fishing | 3,607 (6.5%) |
| Industry & Construction | 13,041 (23.6%) |
| Services | 38,651 (69.9%) |
Source: CSO Census of Population 2022 excludes not stated and unemployed
Download the 2-page WDC Insights County Mayo’s Labour Market
Agency Assisted Employment (2022)
| Permanent Full Time Employment in Agency Assisted Companies | 10,528 |
Source: DETE, Annual Employment Survey 2022
Local Sustainability
| Fertility Rate (2022)* | 10.6 |
| Proportion of seats held by women in the 2019 local election** | 6.7% |
| Domestic Building Energy Ratings (BER) % Grade B2 and above (2023)*** | 10.2% |
* Births per year per 1,000 population. Source: CSO Vital Statistics Yearly Summary
**Source: Department of Housing, Planning and Local Government, Local Elections 2019 Results, Transfer of Votes and Statistics
** Source: CSO Domestic Buildings Energy Ratings
Income and Earnings
| Average Disposable Income per Person 2021* | €21,848 |
| Mean Annual Earnings 2021** | €42,954 |
* Source: CSO County Incomes and Regional GDP
**Source: CSO Ireland, Earnings Analysis using Administrative Data Sources
Business Economy
| Number of Active Enterprises* | 9,416 |
| Percentage of Micro-Enterprises (10 or fewer employees) | 93.1% |
| Percentage Change in Number of Enterprises (2019-2021)* | 9.5% |
Source: CSO Business Demography 2021
* Active enterprises includes all ‘business economy’ enterprises (NACE Rev 2 B to N(-642)) plus Health & Social Work, Education, Arts/Entertainment/Recreation and Other Services.
.
Labour Catchments in County Mayo (2016)*
Download the 2-page county profile of County Mayo’s Place of Residence and Place of Work, 2011 and 2016
| Castlebar labour catchment | 13,931 (2016), 13,757 (2006) |
|---|---|
| Westport labour catchment | 6,380 (2016), 4,854 (2006) |
| Claremorris labour catchment | 2,750 (2016), 2,553 (2006) |
| Ballyhaunis labour catchment | 2,601 (2016), 2,227 (2006) |
| Belmullet labour catchment | 1,859 (2016), 1,924 (2006) |
| Ballinrobe labour catchment | 1,751 (2016), 1,593 (2006) |
| Charlestown labour catchment | 962 (2016), 1,100 (2006) |
| Swinford labour catchment | 1,118 (2016), 1,085 (2006) |
* The labour catchment of a town is that area from which it draws most of its workforce. These figures are the number of workers living in the catchment areas of these towns.
